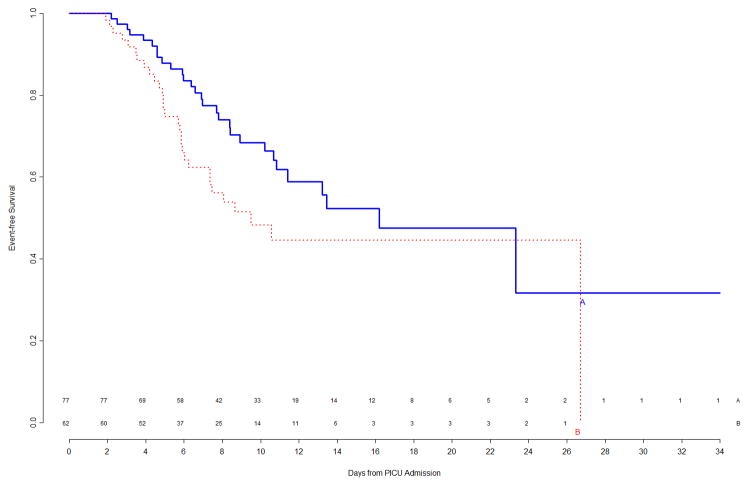
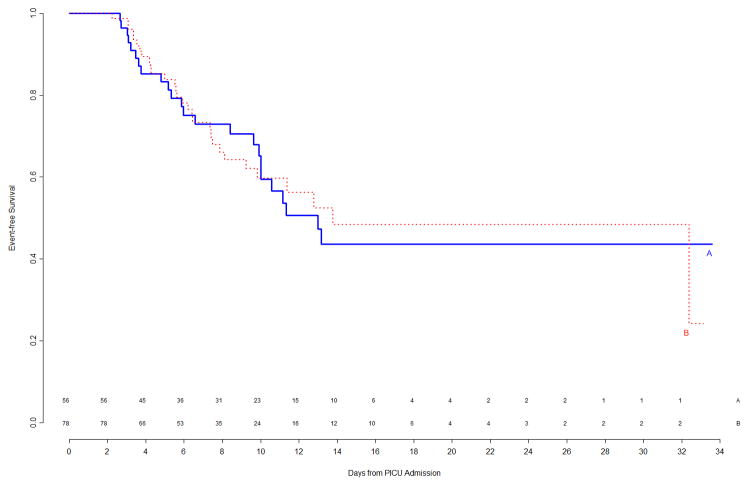
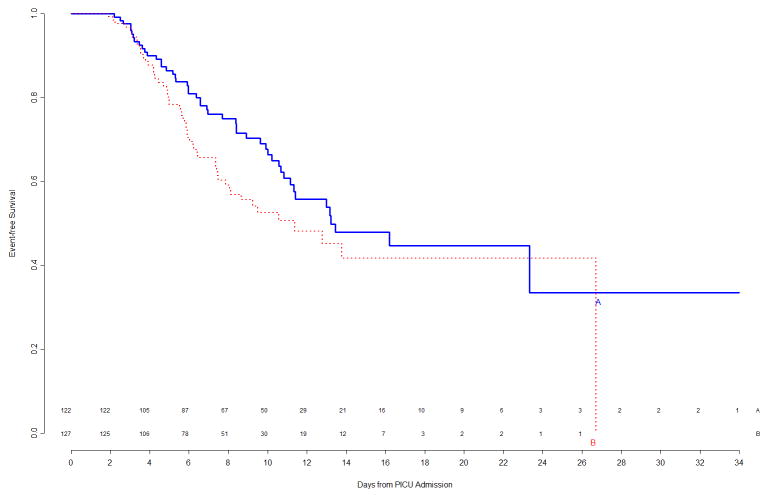
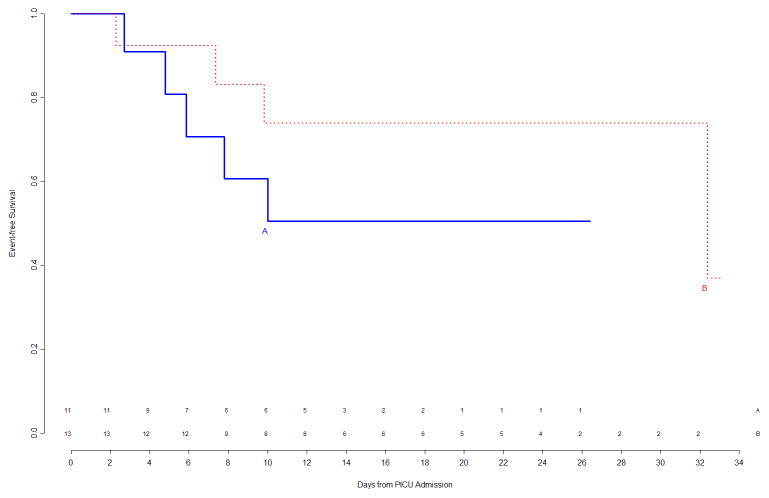
Figure 4.
Top Left Panel: Freedom from nosocomial sepsis according to assigned treatment for patients immunocompetent at study entry, using data available at time of second interim analysis. Numbers above the horizontal time axis denote number of patients remaining at risk at each timepoint. Top Right Panel: Freedom from nosocomial sepsis according to assigned treatment for patients immunocompromised at study entry, using data available at time of second interim analysis. Numbers above the horizontal time axis denote number of patients remaining at risk at each timepoint. Bottom Left Panel: Freedom from nosocomial sepsis according to assigned treatment for female patients, using data available at time of second interim analysis. Numbers above the horizontal time axis denote number of patients remaining at risk at each timepoint. Bottom Right Panel: Freedom from nosocomial sepsis according to assigned treatment for male patients, using data available at time of second interim analysis. Numbers above the horizontal time axis denote number of patients remaining at risk at each timepoint.


