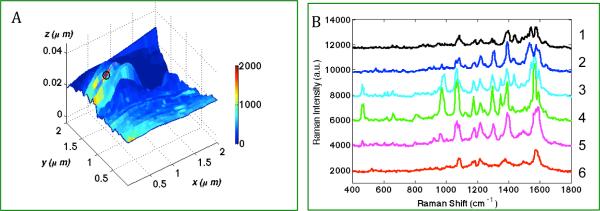
Figure 2.

(A) TERS map with simultaneously obtained topographic features and Raman characteristics from 50nm streptavidin-GNP probe coated on the biotin functionalized microscope slide. Scan size: 2×2 um, TERS step-size = 55nm. Color-bar represents the intensity difference at a streptavidin marker band (965cm−1); (B). Plot of the representative TERS spectra extracted from 6 consecutive pixels along the line y=1.25 μm, (1) x=0.53 μm, (2) x=0.47 μm, (3) x=0.42 μm, (4) x=0.36 μm, (5) x=0.31 μm, (6) x=0.25 μm.
