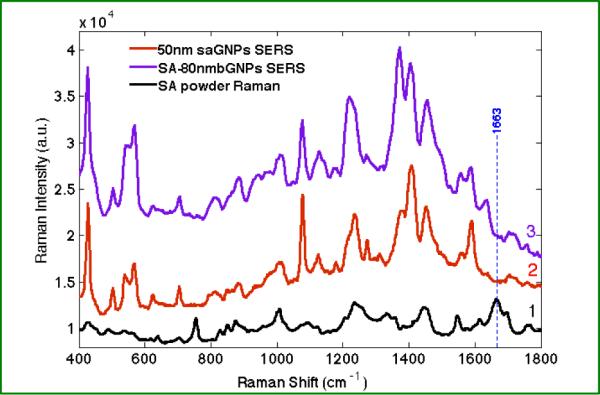
Figure 5.

(1) Normal Raman spectrum of streptavidin (SA) powder, averaged from 6 spectra (30s for each acquisition, 10 accumulations); (2) and (3) show the averaged spectrum of 5–10 SERS spectra of streptavidin-GNPs (saGNP, 50 nm) and streptavidin bound biotinylated-GNPs (80 nm, SA-80nmbGNPs) complex, respectively (5s acquisition). The dotted blue line denotes the amide I peak of streptavidin powder.
