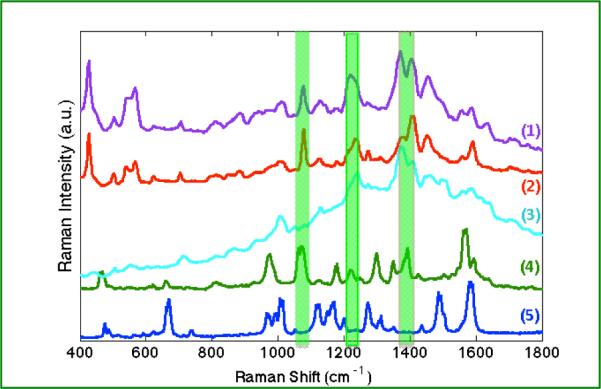
Figure 6.

A comparison of SERS and TERS spectra is shown. SERS spectra obtained from (1) streptavidin/biotinylated-GNPs complex (purple), (2) streptavidin-GNPs (red), (3) biotinylated-GNPs (lt. blue), are compared with TERS spectra from (4) a single streptavidin-GNP on biotinylated surface (green), (5) and a single biotinylated-GNP on streptavidin derivatized surface (blue). Peaks observed at 1072, 1218, 1392cm−1 (green highlights) are indicative of streptavidin in the gap region.
