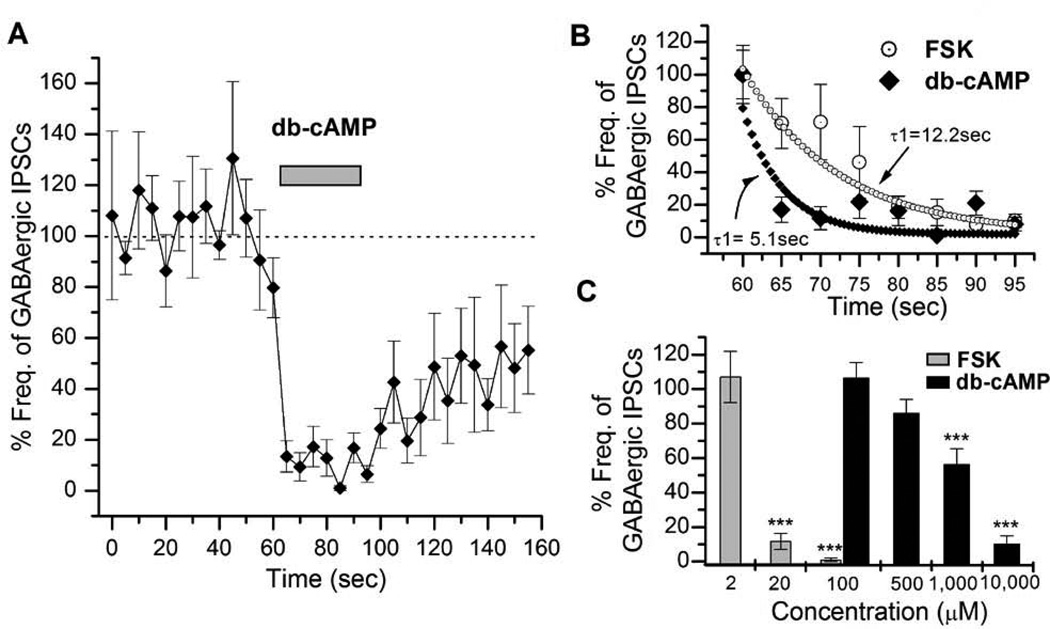
Figure 2. Inhibitory actions of cAMP on GABAergic synaptic transmission.
A, The graph shows the reduction in GABAergic IPSCs (VH = 0mV) on the application of 10mM db-cAMP (n=6) in wild type neurons (n=9). Near complete suppression was seen during 30 seconds of db-cAMP application. In each experiment, db-cAMP was applied at 62.5 sec after initiation of IPSC recording. Bars indicate SEM. B, The plot shows a comparison of the suppression rate of GABAergic IPSCs by FSK (20µM) and db-cAMP (10mM). This rate was calculated using a double exponential fit. The rate of suppression for FSK action was two-fold slower than that of db-cAMP. C, The graph shows effects of different concentrations of db-cAMP (100µM - 10mM) and FSK (2 – 100µM) on GABAergic IPSCs. The suppression potency was determined by averaging percent frequencies for 20 sec from 70–90 sec in a graph similar to A. Error bars indicate SEM. ANOVA test, *** P< 0.001. Number of replicates: FSK – 2µM (n=2), 20µM (n=9), 100 µM (n=5); cAMP - 100µM (n=4), 500µM (n=5), 1,000µM (n=4), 10,000µM (n=6).

