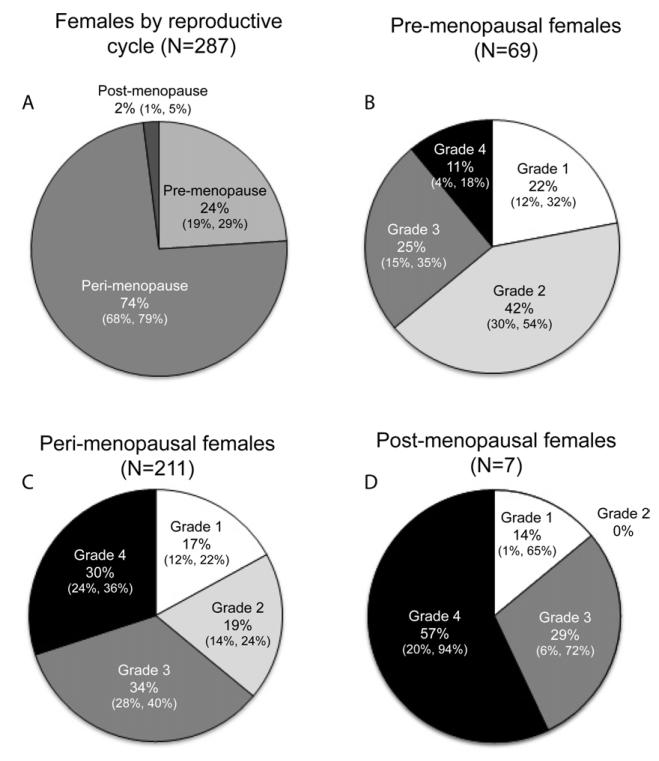
Fig. 5.
Pie charts illustrating the relative proportions of A, pre-, peri-, and post-menopausal females; B, pre-menopausal females in each of the OA severity grades (age range: 6.0—26.12 yrs., x̄ = 16.28 yrs.); C, Peri-menopausal females in each of the OA severity grades (age range: 8.53—33.27 yrs., x̄ = 21.26 yrs.); D, Post-menopausal females in each of the OA severity grades (age range: 22.6—29.47 yrs., x̄ = 26.5 yrs. 95% confidence intervals are presented below frequencies using the following format: (lower, upper).

