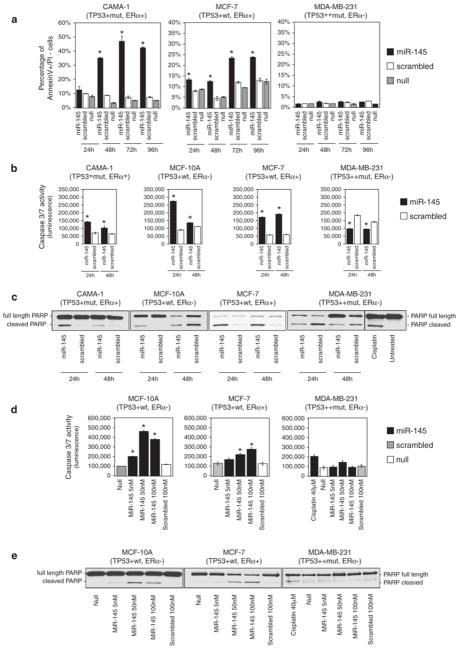
Figure 2.
miR-145 induces apoptosis in BC cell lines. (a) Annexin V staining of BC cell lines at different time points after miR-145 transfection (time 0). For each time point, we measured the percentage of annexin V-positive and propidium iodide-negative cells (annexin V+/PI−) (Y axis). Values represent averages and bars represent S.D. of two independent experiments. (b) Detection of caspase 3/7 activity by luminescent assay (luminescence, Y axis) 24 and 48 h after miR-145 transfection. Cisplatin treatment (40 μM) was used as a control of apoptosis in MDA-MB-231. Values represent average and bars represent S.D. of three replicates. (c) Western blotting of PARP protein in four BC cell lines 24 and 48 h after miR-145 transfection. Two bands are shown, full-length PARP (116 kDa) and cleaved PARP (89 kDa). The cleaved form is the marker of apoptosis. An increased ratio between cleaved and total PARP indicates an induction of apoptosis. (d) miR-145 effects on caspase 3 and 7 activity were measured by luminescent assay (luminescence, Y axis) in three BC cell lines that were transfected with scalar concentrations of miR-145 (100 nM, 50 nM and 5 nM). (e) Western blotting of full-length and cleaved PARP in three BC cell lines after transfection with different concentrations of miR-145 (100 nM, 50 nM and 5 nM). The asterisk represents a statistically significant difference (P<0.05) compared with scrambled by t-test. Null cells were treated only with lipofectamine.

