Figure 2.
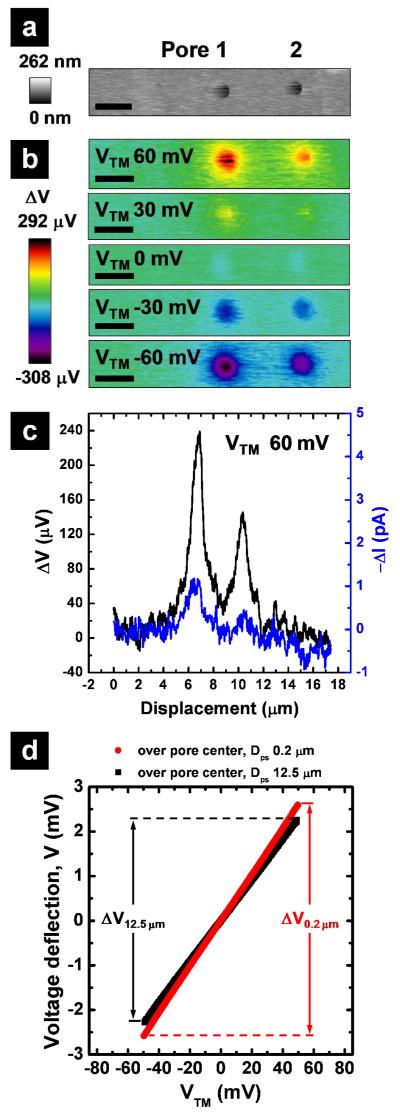
Characterization of porous membranes with P-SICM. (a) Topography of two pores in a polymer membrane at zero transmembrane potential and (b) images of local potential variations for these two pores at a series of transmembrane potentials (VTM), recorded with P-SICM in imaging mode (Scale bar = 1 μm). Improvement in signal-to-noise ratio gained by potential measurement as compared to current measurement was further exemplified with (c) the line scan across the two pores in question. (d) Changes in the potential deflection at two probe surface distances (Dps), far (12.5 μm) and close (0.2 μm), were recorded in fixed position mode over the center of pore 1. With changes in potential deflection determined at Dps equal to 0.2 μm (ΔV0.2 μm) and Dps equal to 12.5 μm (ΔV12.5 μm), apparent conductance associated with pore 1 can be estimated.

