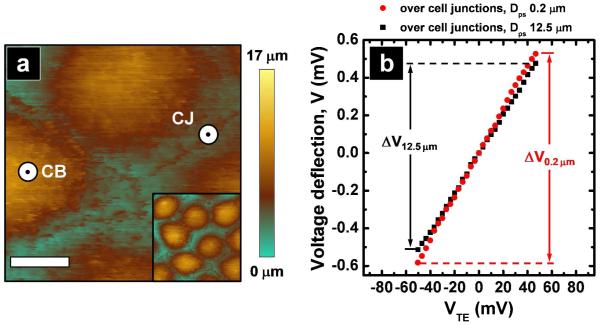
Figure 3.
Characterization of epithelial monolayers with P-SICM (a) Topographic image of the apical surface of a cell monolayer was imaged to locate the position of cell bodies and the cell junctions. Scale bar: 5 μm. The inset shows the zoom out image of the cell monolayer under study (40 × 40 μm). Two positions which illustrate pipette placement are indicated for CB (cell body) and CJ (cell junction). The black marker in the center of the larger white marker at these positions approximates the size of the pipette tip utilized. (b) Potential deflection recorded with fixed position mode at two Dps, far (12.5 μm) and close (0.2 μm), were carried out over the cell junctions to evaluate apparent paracellular conductances.

