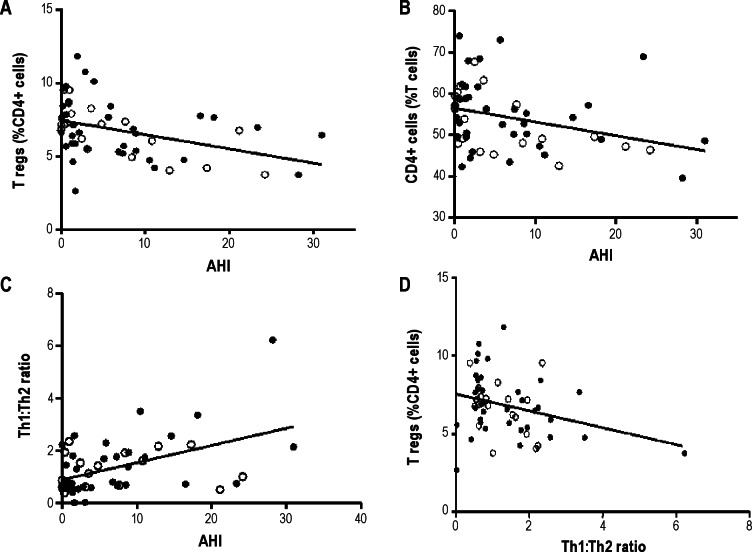
Figure 3.
Scatterplots and linear regression analysis between AHI and the percentage of T reg, CD4+ lymphocytes, Th1:Th2 ratios, and Th1:Th2 ratios plotted against T reg lymphocytes. The open circles are children without asthma or allergies and the closed circles refer to those children with asthma and/ or allergies. (A) Coefficient of correlation: r = -0.46, P = 0.0003. (B) Coefficient of correlation: r = -0.37, P = 0.0047. (C) Coefficient of correlation: r = 0.43, P = 0.0009. (D) Coefficient of correlation: r = -0.29, P = 0.029.

