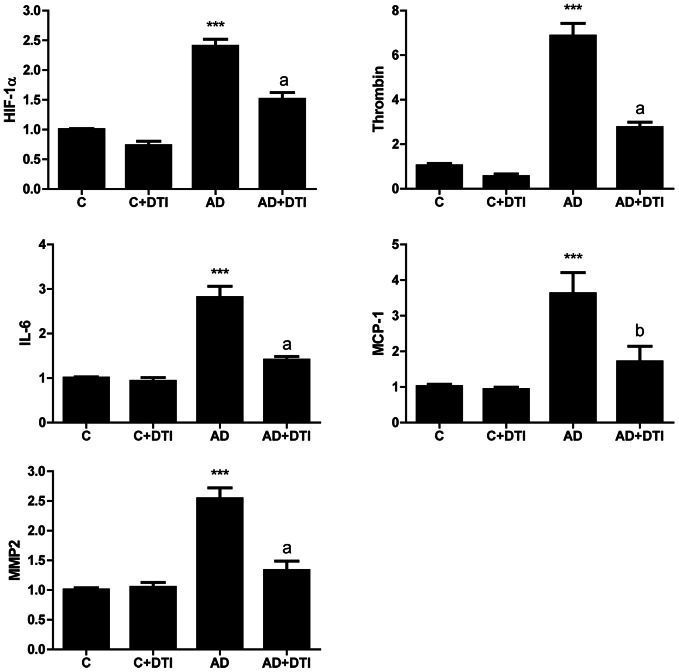
Figure 3.
Brain tissues from control, control + DTI, AD and AD + DTI mice were homogenized, total RNA collected, reverse transcribed and mRNA expression of HIF-1α, thrombin, IL-6, MCP-1, and MMP2 determined by real time PCR. Data are from four mice per group and expressed as fold change over control (C, untreated). ***p < 0.001 vs. C (control); ap < 0.001, bp < 0.01 vs. AD.

