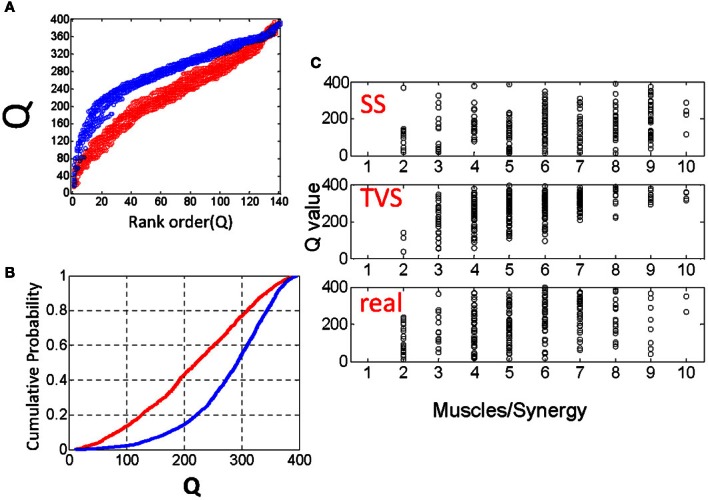
Figure 3.

(A) Comparison of rank ordered Q statistics from five runs of the basic TVS model (blue) (ρ = peaked distribution, σ = 3, η = 1) and five runs of the basic SS model. (B) cumulative probability of the same Q distributions. (C) Comparison of the effect of ρ on local Q statistics for SS models, TVS models, and real data. Note that as ρ increases, Q statistics tend toward higher for TVS models than for real or SS constructed model data.
