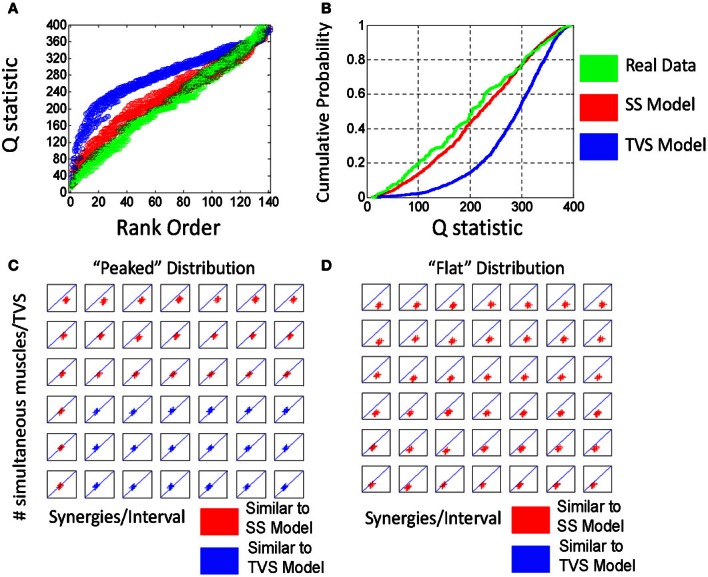
Figure 5.

Q statistically classifies real from EMG data as a synchronous synergy strategy for range of discriminability of the statistic. Linear discriminant separates Qss-Qreal (y axis) and Qtvs-Qreal (x axis). (A) In data drawn from the peaked distribution. (B) Cumulative probability shows TVS/SS distinction. (C) For peaked distribution (see Figure 4A) we find that for a range of discriminable parameters (see Figure 4A) plotted points are less than unity, indicating Qss-Qreal < Qtvs-Qreal. All parameter pairs ρ and η show Qss-Qreal < Qtvs-Qreal. (D) For flat distribution (see Figure 4B) all parameter pairs ρ and η Qss-Qreal < Qtvs-Qreal. In both cases, this is consistent with a model where EMG activity is generated via an SS-type strategy.
