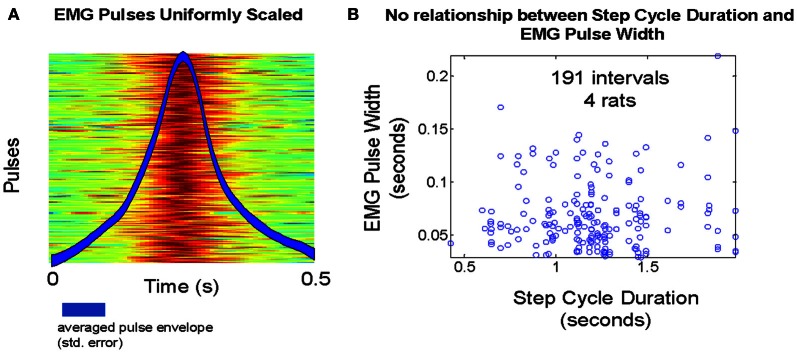
Figure 8.

(A) Temperature plot of pulse amplitudes during treadmill walking in one animal. Overlay: average pulse waveform over all steps. (B) Step cycle duration variability does not appear to induce any systematic variability in EMG pulse full width at half max, as a TVS model predicts.
