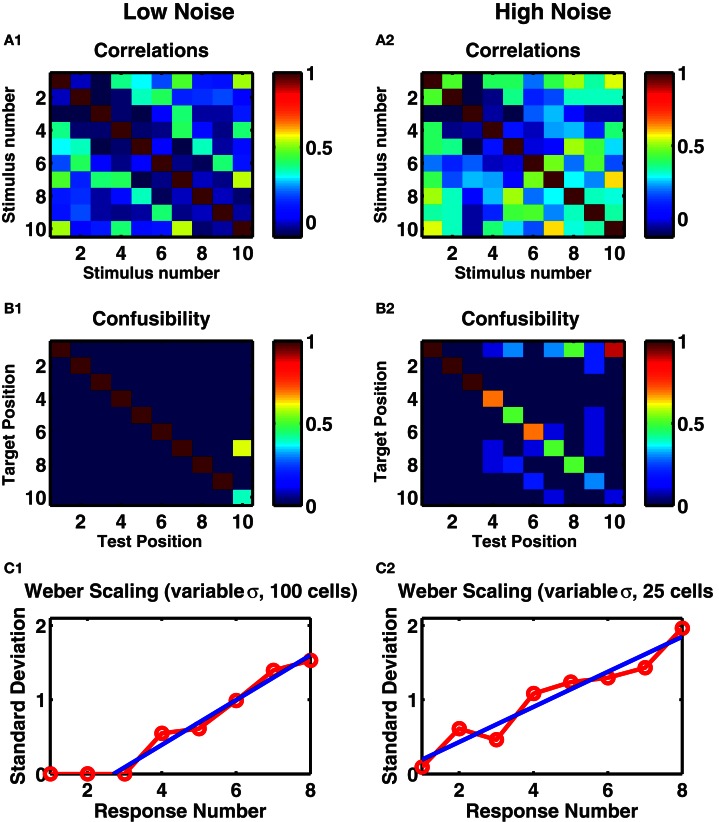
Figure 2.
A randomly connected recurrent network with depressing synapses counts identical stimuli. (A1,A2) Correlations between mean post-stimulus firing rates of all cell-groups as a function of stimulus number. (B1,B2) The confusability matrix indicates the probability of the network activity being most like a given target template following a given number of successive stimuli. Target position corresponds to each of the ten successive stimuli whose mean network activity was evaluated on ten preliminary trials. Recall position denotes each of ten successive stimuli on test trials—following each stimulus, the network activity was measured and compared with target stimuli. Mean of ten trials presented. Color scale: red = 100% correct, green = 50% correct, blue = 0% correct. (A1,B1) Internal noise, σ = 0.002. (A2,B2) Increased internal noise, σ = 0.005. (C1,C2) Standard deviations in the target position as a function of test position. Ten trials of each of ten networks, with different levels of noise, 0.1 < σ < 0.3 in each trial. (C1) Network of 100 cell groups. Fitted line to points 3–8 is y = 0.30x − 0.82. (C2) Network of 25 cells. Fitted line to all points y = 0.24x − 0.04. (C1,C2) Straight line fits have higher adjusted r-square values than polynomial fits to y(x) or x(y), suggesting Weber's Law holds.

