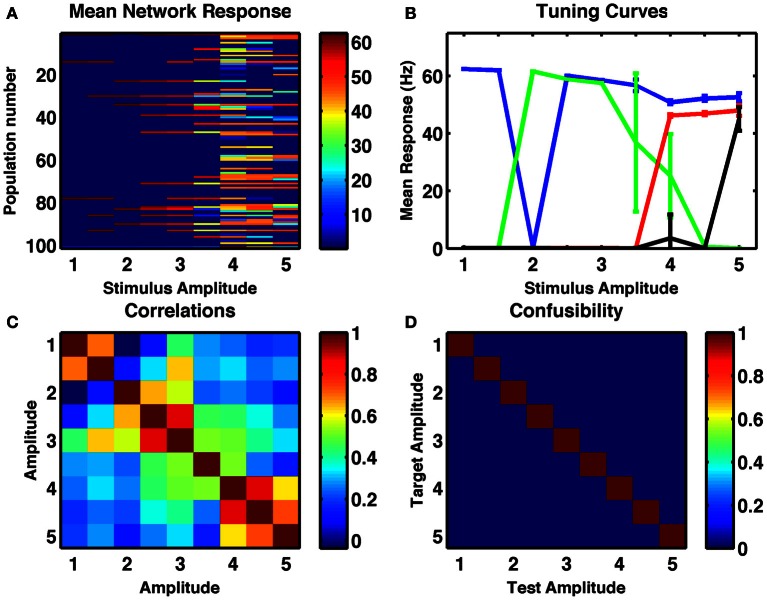
Figure 4.
A randomly connected network with depressing synapses can encode stimulus amplitude. (A) Mean response for all cell-groups following a single stimulus as a function of stimulus amplitude, ranging in steps of 0.5 from 1 to 5. Color indicates firing rate. (B) Responses of four example cell-groups indicate broad tuning to stimulus amplitude. (C) Correlation between network firing rates of cell-groups to different stimulus amplitudes. (D) The confusability matrix (described in Figure 1) indicates the network can differentiate stimulus amplitude into nine completely distinct categories. Internal noise, σ = 0.002.

