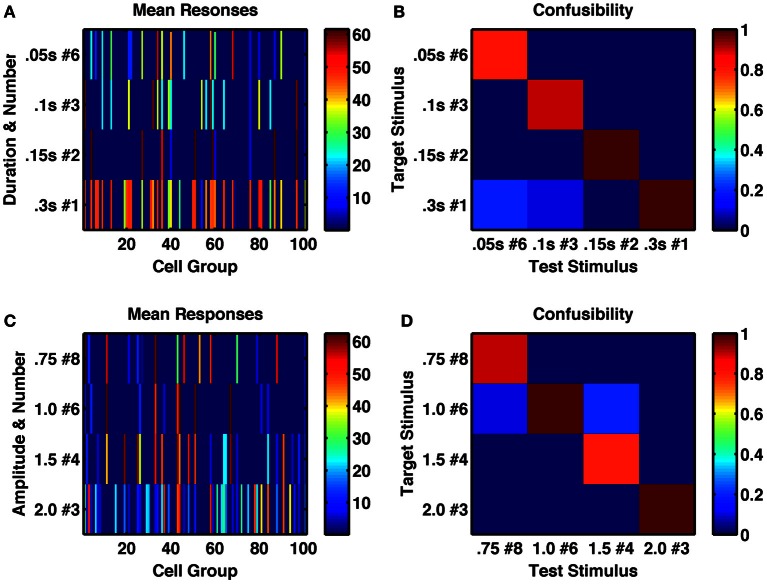
Figure 5.
A randomly connected network with depressing synapses produces distinctive responses to stimulus duration, amplitude and number of repetitions. (A) Mean network response, with color indicating firing rate of each cell-group, following the 6th of a series of 0.05 s stimulations (row 1), the 3rd of a series of 0.1 s stimulations (row 2), the 2nd of a series of 0.15 s stimulations (row 3) and a single 0.3 s stimulus, such that all stimulus combinations produce 0.3 s of total current (amplitude 1.5, σ = 0.002). (B) Confusability matrix between the four types of stimulus combination of (A), indicating the network's response is distinct to each stimulus combination. (C) Mean network response as in (A) to series of 8, 6 4, and 4 stimuli respectively of different amplitudes 0.75, 1.0, 1.5, and 2.0 (such that the product is constant at 6.0). Each stimulus has duration of 0.25 s, σ = 0.002. (D) Confusability matrix between responses to the four stimulus combinations of (C) demonstrates the responses are distinct.

