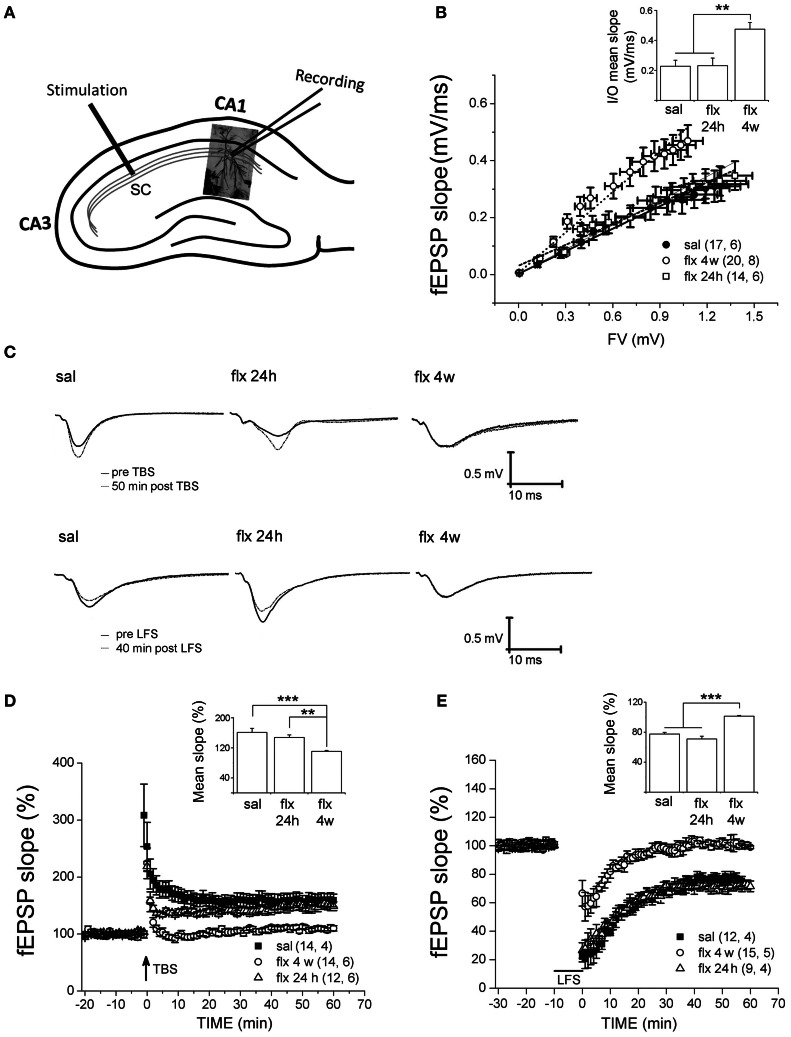
Figure 3.
Four weeks of fluoxetine administration affects basal synaptic transmission and synaptic plasticity at CA3-CA1 synapses. Experiments were performed in slices from saline (sal), single (flx 24 h), and repeated (flx 4 weeks) fluoxetine treatment groups. (A) The diagram shows the stimulating electrode inserted into Schaffer collaterals (SC) and the recording electrode placed in the CA1 s.r. (B) Input/output curves. The fEPSP slopes vs. increasing presynaptic fiber volley (FV) amplitudes were plotted. Data were fit to a linear regression and compared using covariate analysis. The slope obtained in repetitive fluoxetine-treated rats (0.48 ± 0.05, r2 = 0.99) was significantly different (p < 0.01) compared to saline-treated rats (0.23 ± 0.04, r2 = 0.99) or to rats treated with fluoxetine only once (0.23 ± 0.05, r2 = 0.97). Saline, n = 6 (17 slices); fluoxetine 24 h, n = 6 (14 slices); fluoxetine 4 weeks, n = 8 (20 slices). (C) Representative traces of extracellular field recordings are shown before and after LTP (upper panels) or LTD (lower panels) induction. (D) Long-term potentiation (LTP) induced by theta burst stimulation (TBS) and (E) long-term depression (LTD) induced by low frequency stimulation (LFS) were blocked in hippocampal slices of rats treated for 4 weeks with fluoxetine. Bar graphs represent the mean % change in fEPSP slopes compared to baseline, from 45 to 60 min after LTP (D inset) or LTD induction (E inset). LTP: sal, n = 4 (14 slices); flx 4 weeks, n = 6 (14 slices); flx 24 h, n = 6 (12 slices). LTD: sal, n = 4 (12 slices); flx 4 weeks, n = 5 (15 slices); flx 24 h, n = 4 (9 slices). Data from D and E were statistically evaluated by one-way ANOVA, followed by a Bonferroni post hoc test. **p < 0.01, ***p < 0.001.

