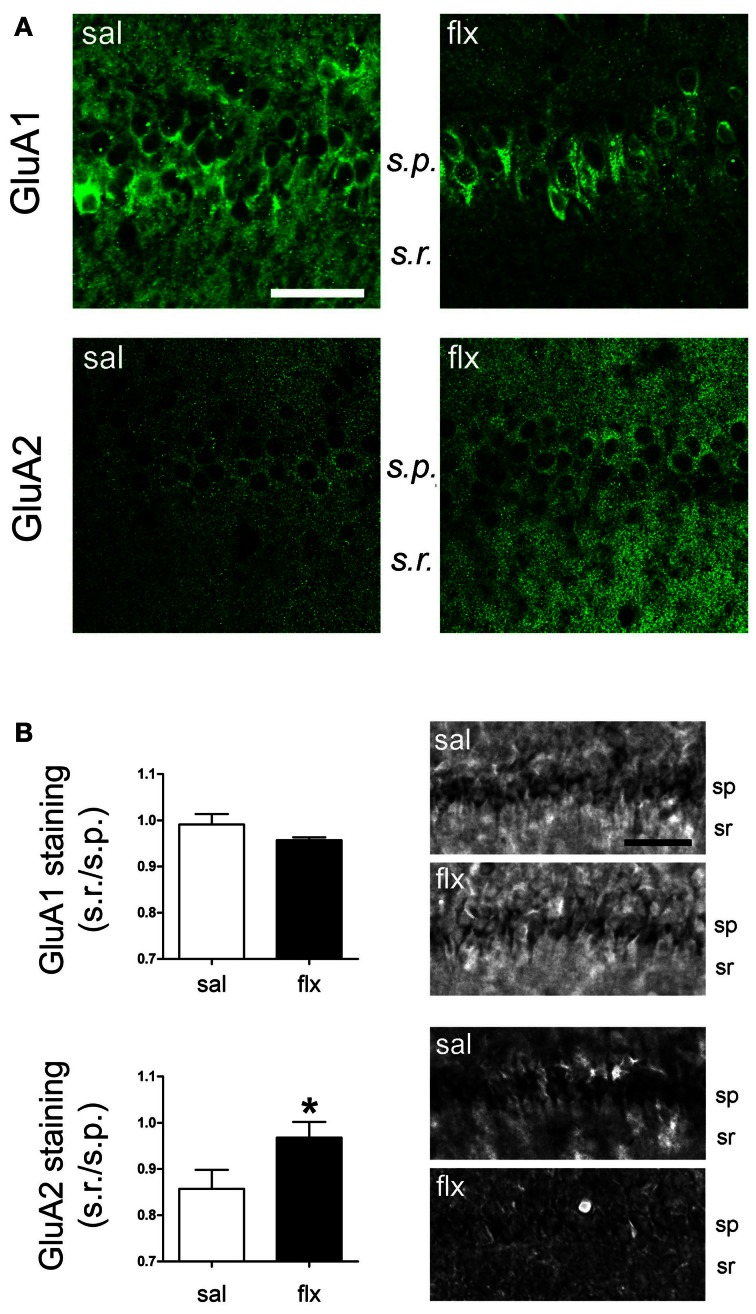
Figure 5.
GluA1 and GluA2 were detected in the CA1 region by immunofluorescence and immunohistochemical staining. (A) Fluorescence images of GluA1 and GluA2 immunostainings reveal a change in the distribution of subunits between the cell soma (s.p.) and dendritic (s.r.) compartments. (B) Relative staining intensity (s.r./s.p.) of immunohistochemical GluA1 and GluA2 stainings revealed higher GluA2 intensity in the s.r. of fluoxetine-treated rats (*p < 0.05, n = 5−7, Student t-test). s.r., stratum radiatum; s.p., stratum pyramidale. Scale bars: 50 μm.

