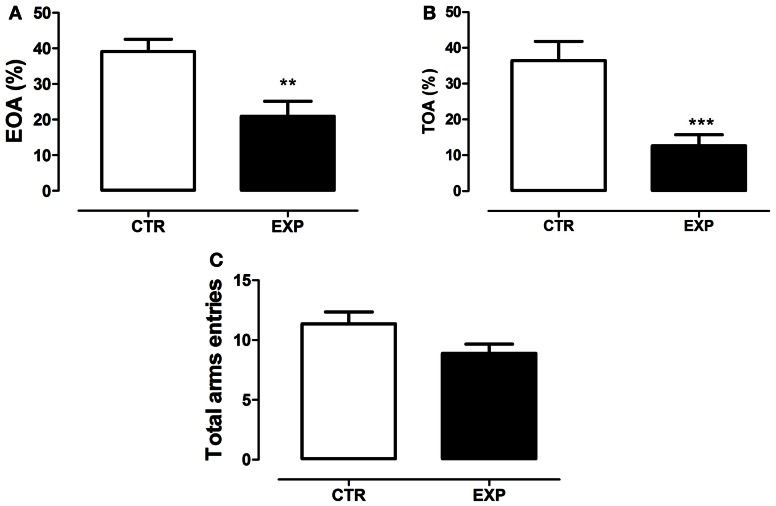
Figure 5.
Percentage of entries onto the open arms (A), percentage of time spent on the open arms (B) and total entries in both arms (C) are shown as mean ± standard error. Control group (CTR) n = 14 and Experimental group (EXP), n = 16. EXP exhibited less entries (A) and time (B) on the open arms as compared to CTR group (***p = 0.0008 and **p = 0.001). In (C), the locomotor activity was only marginally different between groups (p = 0.055).

