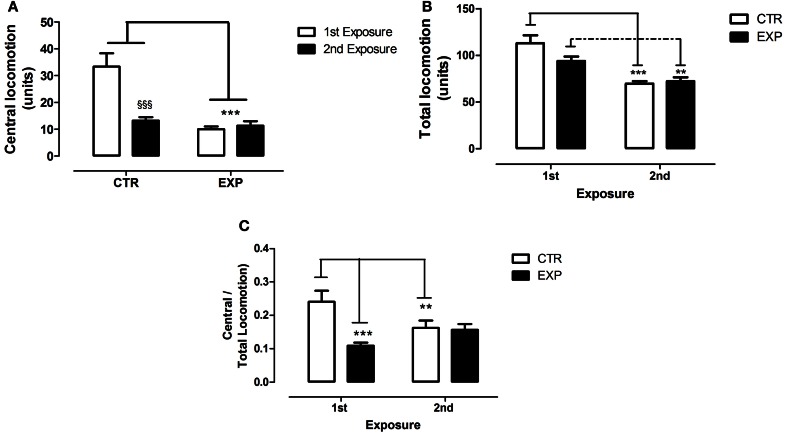
Figure 7.
Central (A), total locomotion (B) and (C) ratio of central to total locomotion are shown as mean ± standard error in both exposures. Control group (CTR) n = 14 and Experimental group (EXP), n = 16. Reduced central locomotion was noted for EXP in both exposures. In CTR, the locomotor activity in central squares decreased significantly during second exposure (A). The total locomotion did not differ between groups, but decreased significantly during 2nd exposure (B). In (C), the ratio of central to total locomotion was significantly less in EXP as compared to CTR, decreased on the 2nd exposure for CTR and was kept unchanged for EXP. **p < 0.001, ***p < 0.0001 and §§§p < 0.0001.

