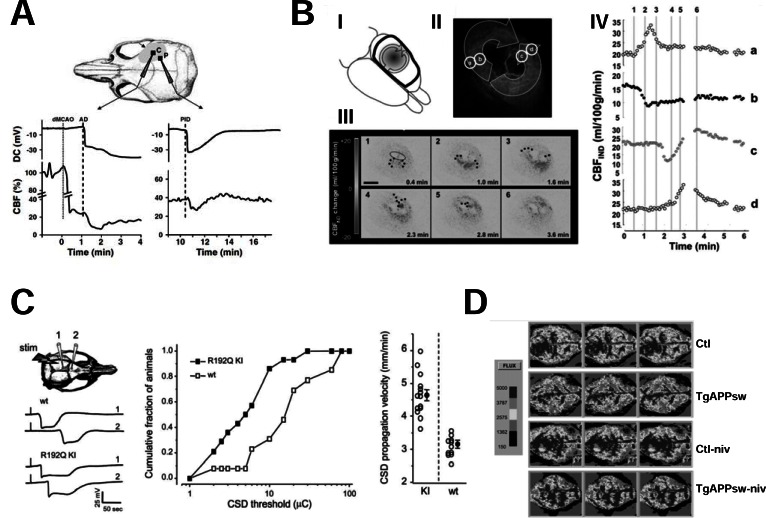
Fig. (4).
Changes in CBF in neurodegenerative and neurovascular disorders and their modulation by VGCCs. A, after MCAO, anoxic depolarization (AD) and postischemic depolarizations (PIDs) cause a marked drop in CBF. The two plots show the time course of DC currents and of CBF simultaneously recorded in the core (on the left) and in the penumbra (on the right) of the ischemic lesion caused by MCAO in a C57BL/6J mouse. The straight line in the left plot indicates the time of MCAO induction whereas the dotted lines correspond to the beginning of AD in the plot on the left, and to the beginning of PID in the plot on the right, respectively. The schematic draw on the top illustrates the position of the two extracellular recording electrodes. Note the sudden drop in CBF immediatly after AD in the core or PID, in the penumbra (reproduced with permission from Shin et al., 2006 [166]). B, waves of vasoconstriction cycle around the ischemic core and contribute to enlarging the ischemic lesion. The arrows in the schematic draw in I represent the front of propagation of the changes in indicative CBF (CBFIND) occurring after MCAO in adult male Wistar rats. In II a laser speckle image from a representative animal is shown. Note that CBFIND in the inner “core” region markedly decreases (black in II), that the region immediately surrounding the core (b and c in II) shows a hypoaemic response whereas a hyperemic response with an increase in CBFIND increases occurs in the outer border of the lesion (a and d in II). These changes in CBFIND propagate distally from the core in opposite directions thus originating two different fronts of propagation. As shown in III, these fronts of propagation (indicated by the black dots) cycle around the ischemic core and collide in a position opposite to their origin. The plot in IV reports the time course of CBFIND in the different regions of interest a, b, c and d identified in II. Note that whereas in the outer regions (a and d) CBFIND significantly increases (hyperaemic response), in the inner regions b and c a decrease in CBFIND (hypoaemic response) is observed followed (as in c) or not (as in b) by a secondary hyperaemia (reproduced with permission from Nakamura et al., 2010 [182]). C, CaV2.1-encoded P/Q channels have a role in the propagation of CSDs. The plot on the left of the panel shows that CSDs last longer and propagate faster in mice harboring the R192Q migraine mutation in the Ca2.1 gene. The graph in the middle shows that the distribution of CSD threshold is right-shifted in R192Q CaV2.1 transgenic mice as compared with controls whereas the scatter plot on the right reports the individual values of CSD propagation velocity in the different animals of the two groups (reproduced with permission from van den Maagdenberg et al., 2004 [187]). D, nivaldipine restores normal CBF in a transgenic mouse model of Alzheimer’s disease. The panel shows two-dimensional maps of the regional blood flow measured with laser Doppler flowmetry in the cortex of 13 month old control mice (ctl), transgenic mice harboring the APPK670N,M671L mutation (TgAPPsw), and control (ctl-niv) or TgAPPsw (TgAPPsw-niv) mice treated with nivaldipine (1 mg/kg of body weight daily for 15 days). Different CBF values correspond to different gray intensities as indicated in the gray scale reported on the left of the panel. Note that the very low CBF in TgAPPsw cortex is restored to values comparable to those of control mice upon treatment with nivaldipine. Conversely, this CCB does not modify CBF in control mice (reproduced with permission from Paris et al., 2004 [223]).

