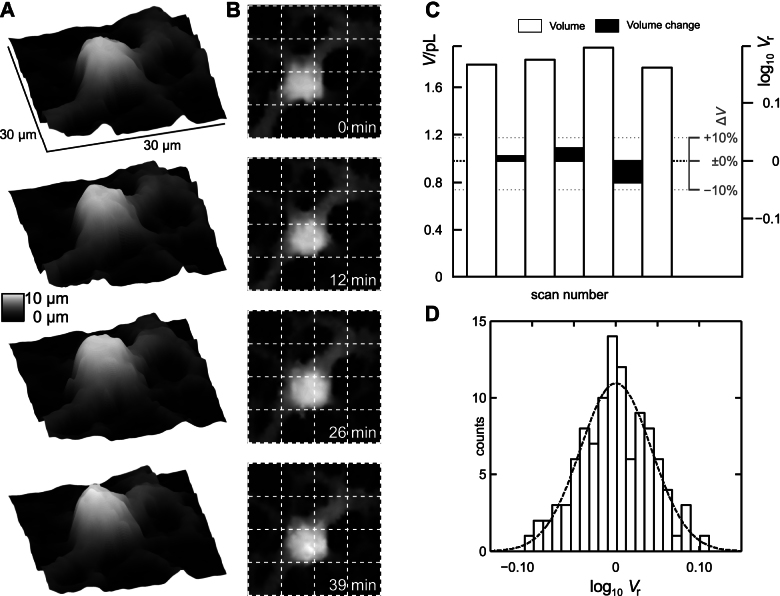
Figure 1. Determination of volume changes in mature oligodendrocytes by scanning ion conductance microscopy.
(A,B) Three dimensional (A) and top-view (B) plots of four successive scans of a mature oligodendrocyte. Scans were obtained immediately after the previous scan had finished. Lateral step size was 1 μm, vertical step size was 0.1 μm, scan size was 30 × 30 μm2, data shown interpolated by cubic splines. Grey scale indicates height. Note that the oligodendrocyte remained stationary (dislocation amounted to 0.4 μm, 0.5 μm and 0.9 μm, respectively). (C) Calculated absolute (white bars) and relative volume (black bars, logarithmically scaled axis at the right, for easier recognition changes in percent are indicated by the small grey axis) of the cell shown in (A, B). The cell slightly swelled between scans 1, 2 and 3, yielding positive relative volumes and shrank approximately to the volume of scan 1 in scan 4 yielding a corresponding negative relative volume. (D) Histogram of relative volumes of mature oligodendrocytes. Bars represent counts of relative volumes per bin, bin size is 0.011; n = 106 calculations of relative volume between two successive scans obtained from 21 different cells. Note that bins represent relative volume at a logarithmic scale. Mean is 0.00 ± 0.04 (SD). Dotted line indicates a gaussian fit to the data, R2 = 0.86.

