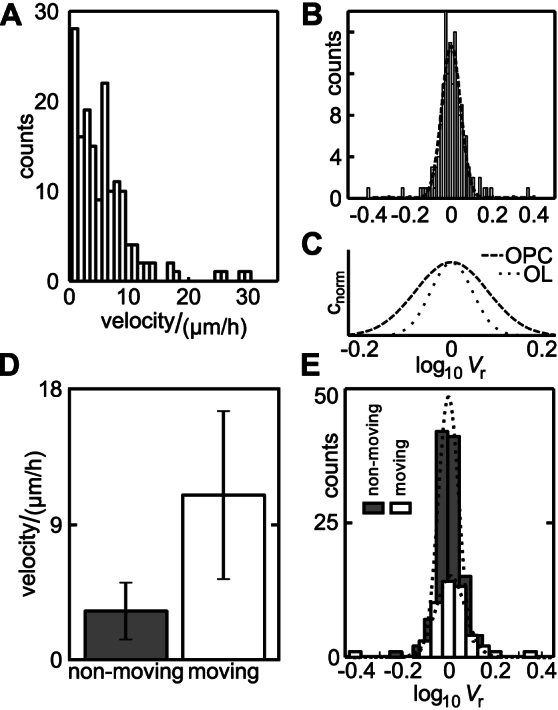
Figure 2. Average velocities and relative volume changes of oligodendrocyte progenitor cells.

(A) Histogram of the velocities determined from SICM scans (see Material and Methods section, bin size 1 μm/h; n = 161 determinations from 33 different cells; mean velocity: 5.6 μm/h ± 5.1 μm/h (SD), minimum and maximum velocities: 0.17 μm/h and 30.03 μm/h, respectively). (B) Histogram of the relative volume measurements of OPCs. Bars represent counts of relative volume per bin, bin size is 0.011 (as in Fig. 1D), bins represent relative volumes at a logarithmic scale. Mean value: 0.00 ± 0.07 (SD). Dashed line indicates a gaussian fit to the data, R2 = 0.93. (C) Normalised fits to the relative volumes of adult oligodendrocytes (OL, dotted line, see Fig. 1D) and OPCs (dashed line, see B) on the same x-scale. (D) Mean velocities of the cells classified as moving and non-moving. Moving: v > 6.5 μm/h, yielding 30% moving cells. Error bars indicate ± SD. (E) Histograms of relative volumes of non-moving (grey bars, n = 112) and moving (white bars, n = 49) cells. Bin size 0.05, relative volume displayed at logarithmic scale. Mean values: 0.02 ± 0.10 and 0.00 ± 0.05 for moving and non-moving cells, respectively. Dotted lines indicate a gaussian fit to the respective data. R2 = 0.98 for both fits.
