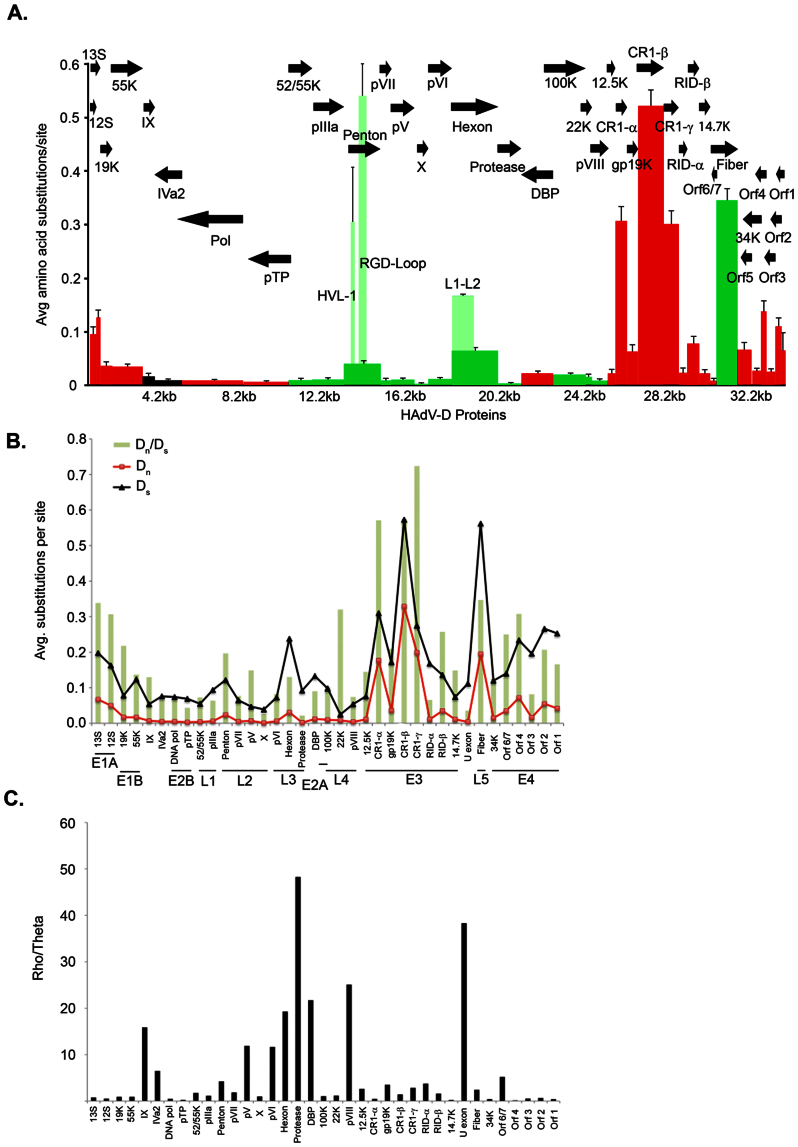
Figure 2. HAdV-D evolution.
(A) Amino acid diversity calculated in MEGA 4.02, measuring the average amino acid substitution for each HAdV-D protein. Each bar in the graph corresponds to a protein as represented by arrows. Red = early. Light green represents the hypervariable region of the hexon and penton base. Dark green = late genes. Black = intermediate genes. (B) Analysis of synonomous and non-synonomous mutations across the HAdV-D genome calculated using MEGA software. Synonomous (Ds) and non-synonomous (Dn) changes are represented in black and red lines, respectively. Green bars represent the ratio (Dn/Ds) for each gene. (C) Analysis of the rho (recombination) and theta (mutation) ratio as determined by DnaSP for each gene in the HAdV-D genome.

