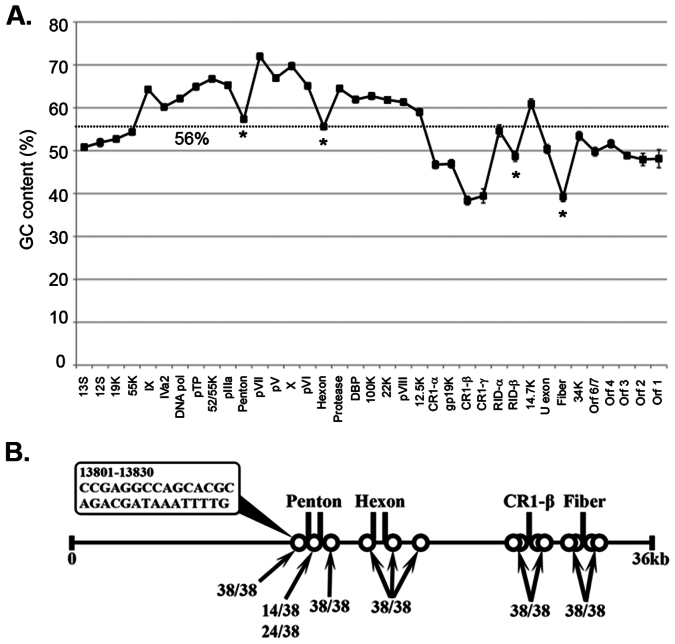
Figure 4. HAdV-D recombination analysis.
(A) Average % GC content per gene across the HAdV-D genome is presented. Error bars represent standard deviation. Dotted line represents the average % GC content across the whole genome. The penton base, hexon, and fiber genes all showed a significant decline in GC content compared to their nearest neighbor genes (*p < .0014). (B) Recombination hot spot analysis. A 15 bp sliding window was used to analyze GC to AT transition zones (10% threshold over mean % GC content). The HAdV-D genome is represented by a horizontal solid line. Vertical solid lines and circles indicate homologous regions and potential recombination hot spots. A penton base GC to AT transition zone example is presented in the bubble.

