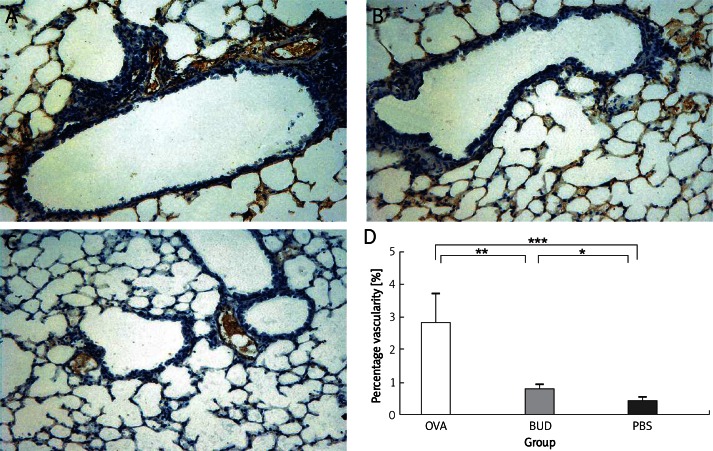
Figure 2.
vWF-positive vessel area in lung tissue of mice. Vessel area was significantly increased in the OVA group compared with that in the PBS group, and was reduced in the BUD group. A – OVA group, B – BUD group, C – PBS group, D – percentage of vascularity. Magnification is 200×
Data are shown as mean ± SEM. *p < 0.05, **p < 0.01, ***p < 0.001

