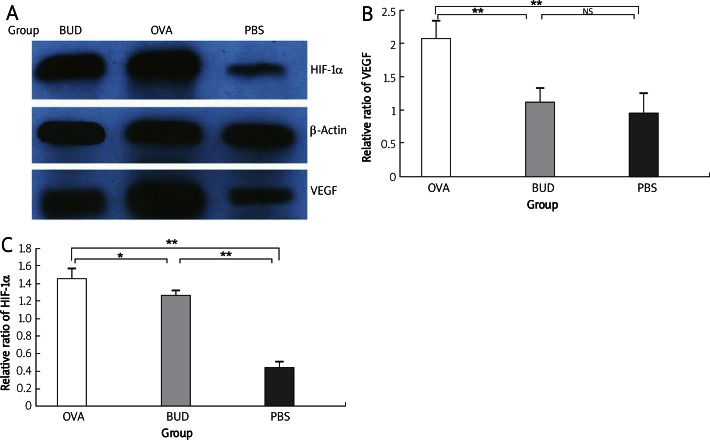
Figure 4.
VEGF and HIF-1 expression by Western blotting. Consistent with the results of immunohistochemistry, the relative ratios of VEGF and HIF-1α to β-actin level revealed that both were significantly upregulated in the OVA group compared with those in the PBS group, and were downregulated in the BUD group. A – X-ray film by Western blotting, B – relative ratio of VEGF to β-actin, C – relative ratio of HIF-1α to β-actin
Data are shown as mean ± SEM. *p < 0.05, **p < 0.01. NS – not statistically significant

