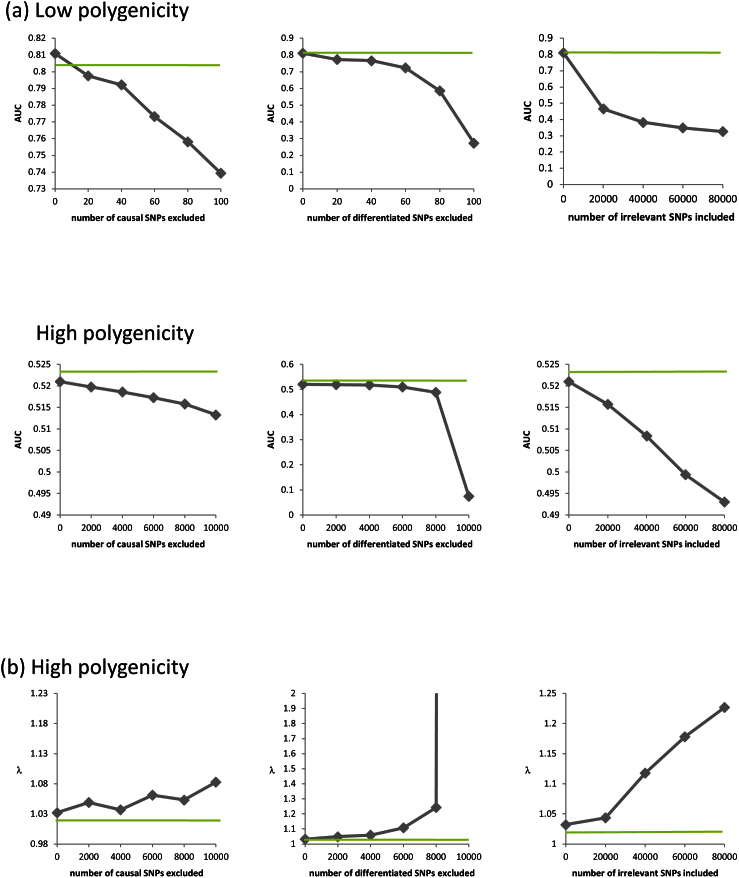
Figure 3. The effects of excluding relevant SNPs and including irrelevant SNPs on power and inflation.
(a) AUC as a function of the number of the causal SNPs excluded (with no irrelevant SNPs included), the number of differentiated SNPs excluded (with no irrelevant SNPs included), and the number of irrelevant SNPs included for the low and high polygenicity cases (including all relevant SNPs). (b) The genomic control factor λ as a function of the number of causal SNPs excluded (with no irrelevant SNPs included), the number of differentiated SNPs excluded (with no irrelevant SNPs included), and the number of irrelevant SNPs included for the high polygenicity case (including all relevant SNPs). The performance of the simple variable-selection method is indicated with green lines. The only plot with a non-monotonic pattern is the one showing λ as a function of the number of causal SNPs excluded (lower left). Nonetheless, the effect is significant in that, with 6,000 or more causal SNPs excluded, the GWAS P value distributions differ significantly from uniform according to a two-sided KS test (P values 0.047, 0.021, and 0.002 for 6,000, 8,000, and 10,000 SNPs excluded, respectively).

