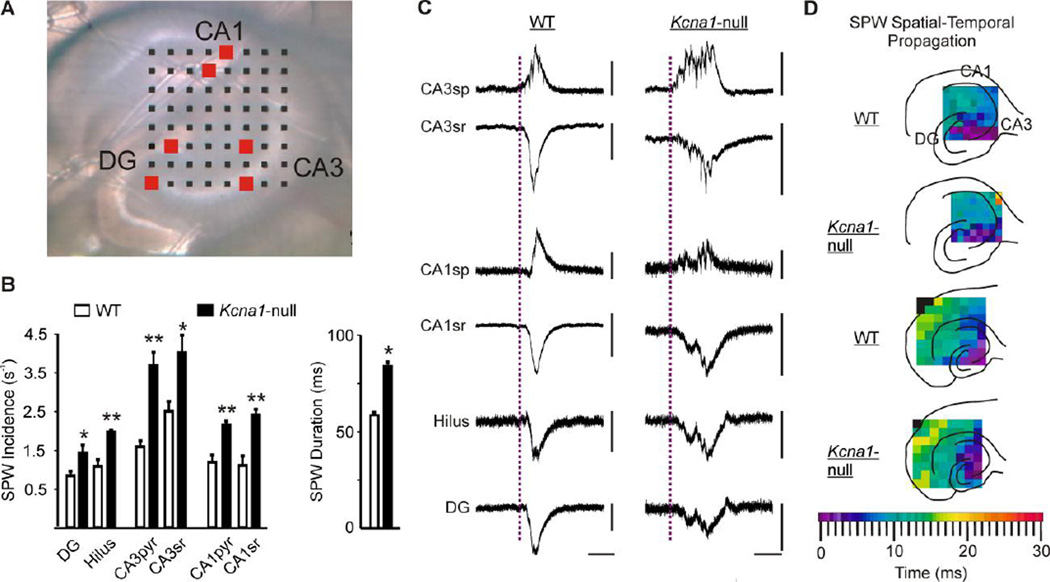
Figure 1. Kcna1-null SPWs have a higher incidence rate throughout the hippocampus and are longer in duration.
(A) A digital image of a Kcna1-null (KO) hippocampal slice on an 8×8 multi-electrode array comprised of 50×50 µm electrodes and an inter-polar distance of 150 µm. (B) Left bar graph, Hippocampal slices from KO (n = 20) exhibit an increased SPW incidence rate in all regions compared to wild-type (WT) slices (n = 15). Right bar graph, SPW duration measured in the CA3sr region is increased in KO (n = 9) compared to WT slices (n = 11). (C) Representative SPWs from a WT and a KO slice from the corresponding hippocampal regions indicated by the red boxes in A. Calibration bars: x-ordinates are 50 ms; all y-ordinates are 50 µV except for WT and CA3sp (100 µV), WT CA3sr (200 µV), KO CA1sp (20 µV), and WT CA1sr (200 µV). (D) Representative examples of spatial-temporal propagation demonstrating SPWs are initiated in CA3 in WT and KO slices and spread with similar time-courses. The top two illustrations depict SPW propagation in hippocampi using a multielectrode array with inter-electrode spacing of 150 µm. The bottom two illustrations demonstrate propagation into the entorhinal cortex recorded with inter-electrode spacing of 300 µm. *p<0.05; **p<0.001. CA, cornus ammonis; DG, dentate gyrus; sg, sp, sr, strata granulosum, pyramidale and radiatum, respectively.

