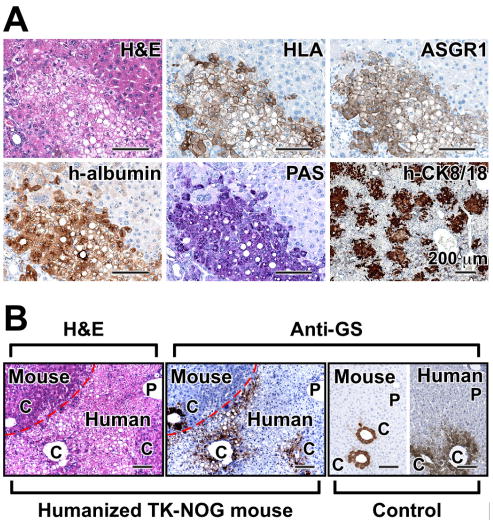
Figure 2.
(A) Histology and immunohistochemistry of the liver of humanized TK-NOG mice. Serial liver sections were stained for H&E, HLA, ASGR1, h-albumin, PAS, and h-CK8/18. Scale bars, 100 μm. (B) The position-specific pattern of GS expression within the liver lobule. H&E and immunohistochemical staining with anti-GS antibody in liver sections obtained from humanized TK-NOG mice 14 weeks after transplantation of human liver cells. The ‘Mouse’ and ‘Human’ hepatocyte boundary is indicated by a dashed line in the images on the left. Liver sections from control NOG or human livery sections that were stained with the anti-GS antibody are shown on the right. Scale bars: 100 μm. P, portal tract; C, central vein.

