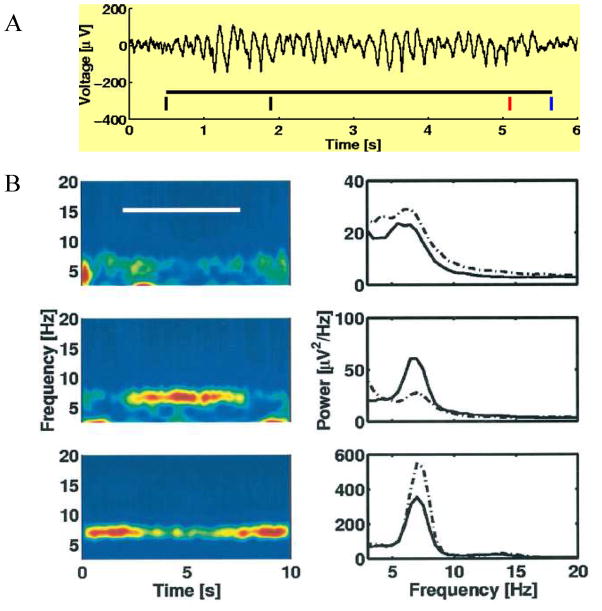
Fig. 9.
Theta power is gated up at some cortical sites and down at others during the period of working memory. (A) With intracranial recordings, large-amplitude theta can be observed in single trials of the Sternberg task. First black bar is the time of cue presentation; second black bar indicates presentation of the item to be remembered; at the red bar, the test item is presented and the subject indicates (at the blue bar) whether it is the same as the remembered item. In other trials, more items were presented. (B) Recordings from three sites where task (white bar) had little effect on theta power (top), where it produced an increase in theta power (middle), or where it produced a decrease in theta power (bottom). Color code at right indicates theta power. From Fig. 8 of (Raghavachari et al., 2001).

