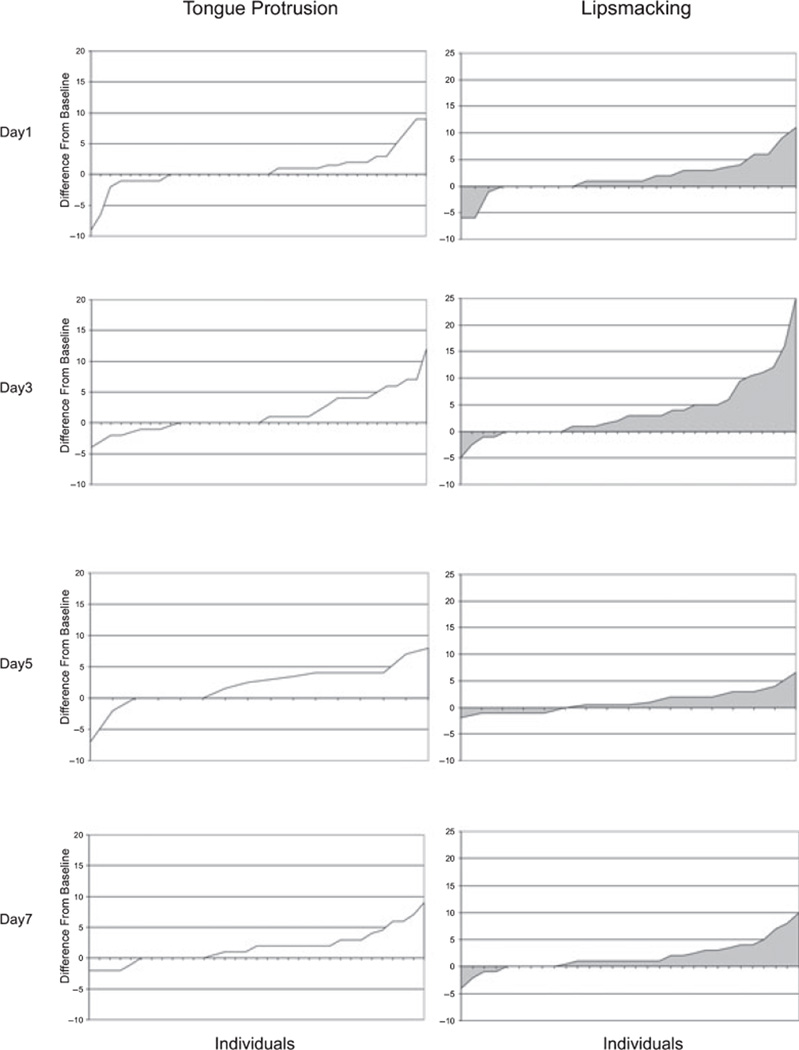
Figure 4.
Each graph depicts the neonatal imitative scores of each individual. Each tick on the x-axis represents an individual. A negative score indicates that a behavior was observed more frequently during baseline; a positive score indicates that a behavior was observed more frequently during the stimulus period. The scores have been ordered from left to right in ascending order. Each tic represents a single infant. Note that an infant that had an imitative score on a specific day is positioned on a specific place along the abscissa. The same infant is not necessarily represented in the same position in the graph portraying a different day. Left and right graphs refer to the imitative scores obtained by infants categorized according to their neonatal imitative responses to tongue protrusion and lipsmacking gestures, respectively.

