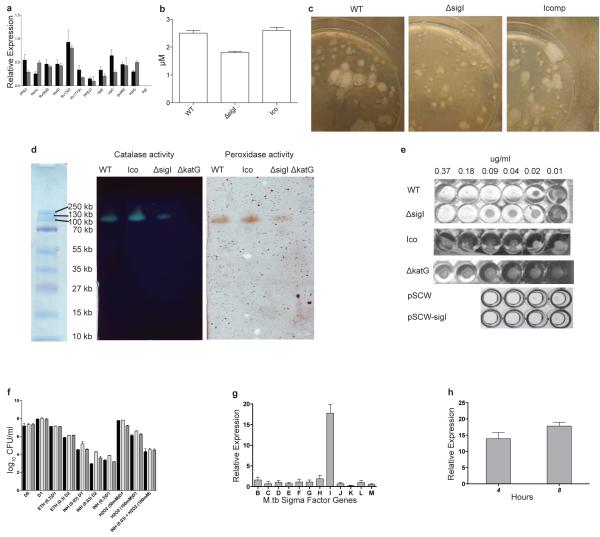
Figure 2. in vitro characterization of M.tb. ΔsigI.
(a) The down-regulation of genes, including katG, which were identified by microarray in the ΔsigI mutant, was confirmed by qRT-PCR. Data represent gene expression (based on copy number) of the mutant compared to wild-type. (b) Catalase activity within total cell lysates from wild-type M.tb., the ΔsigI mutant, and the complemented strain (Ico). (c) Catalase activity from bacteria growing on a 7H10 agar plate was detected with 10% H2O2. (d) Bacterial lysates were resolved by native PAGE. Catalase activity was visualized using 1% ferric chloride and 1% potassium ferricyanide. Peroxidase activity was visualized using a solution of 0.5 mg/ml p-diaminobenzidine, 3mM H2O2. (e) INH MIC assay results for wild-type and ΔsigI M.tb. strains, as well as the sigI overexpressing strain (pSCW-sigI) and its empty vector control strain (pSCW). (f) Wild-type (black bars), ΔsigI mutant (light gray bars), and complement (dark gray bars) strains were exposed to INH, ETH, H2O2 and INH + H2O2 for 1 or 2 days and then plated on 7H10 agar for CFU enumeration. The combined INH and H2O2 exposure was for 1 day. The ETH and INH concentrations are in ug/mL, and the H2O2 concentration is in mM. (g) Expression levels of M.tb. sigB-sigM following 4-hours of acetamide-induced overexpression of sigI (relative to expression prior to acetamide exposure). (h) M.tb. katG expression after 4 and 8 hours of acetamide-induced expression of sigI. Three biological replicates of all experiments were performed, and error bars represent standard deviation.

