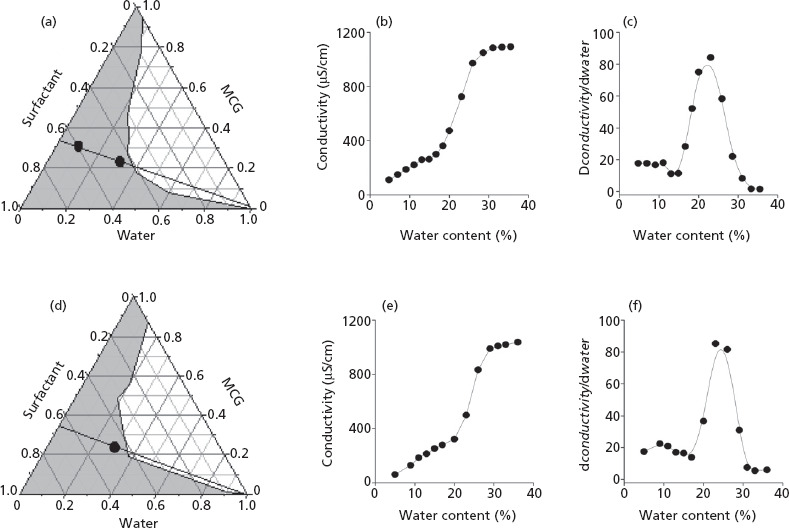
Figure 1.

Phase diagrams and conductivity as a function of aqueous content of mixtures composed of decylglucoside : propylene glycol (1:1 w/w), water and mono- and dicaprylin (MCG) (A–C) or decylglucoside : propylene glycol (1 : 1 w/w), water MCG and phytosphingosine (D–F). The phase diagrams (A and D) show the dilution lines investigated in the conductivity studies (black lines in the diagrams), and the composition of microemulsions ME-O, ME-W and ME-Wphy. Panels C and F show the conductivity change (dconductivity/dwater) as a function of water content to determine the percolation threshold.
