Figure 6.
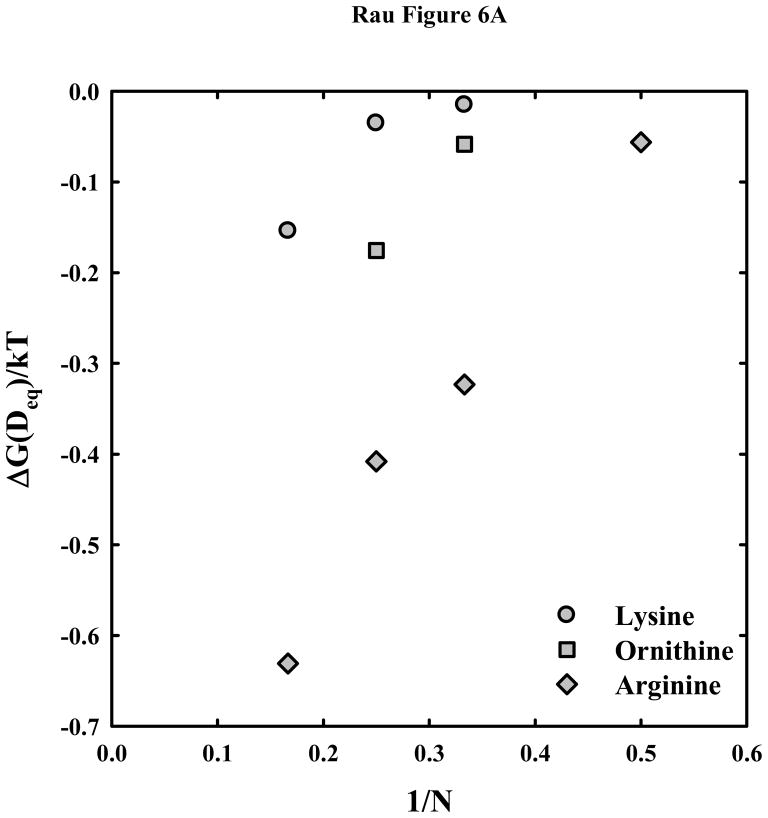
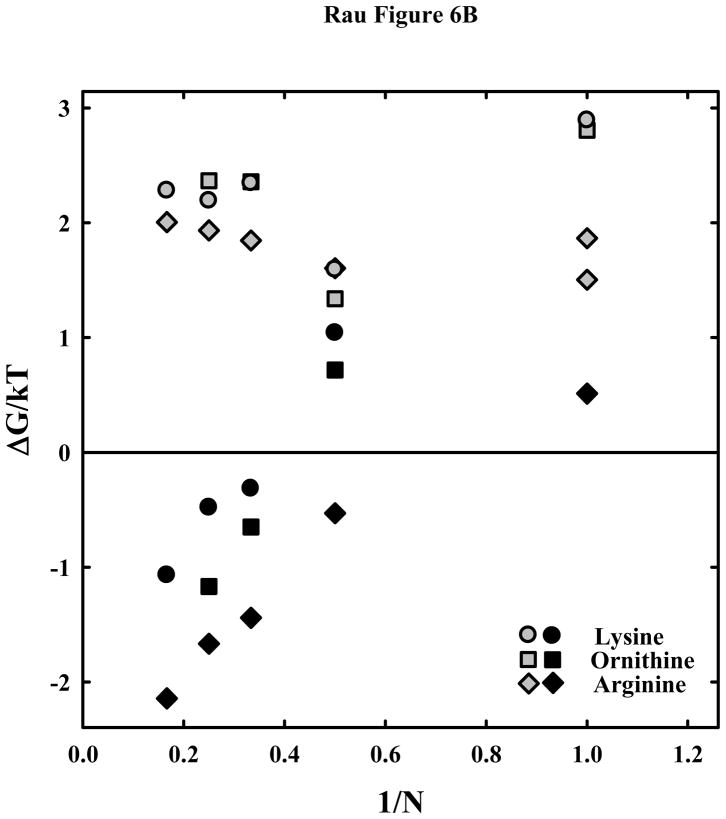
Dependence of the interaction free energies on peptide length N. (A) – The free energy of interaction (in units of kT/bp) at the equilibrium spacing, Deq, is calculated from the double exponential fits to the osmotic stress data and equation (7) for the arginine
 , ornithine
 , and lysine
 peptides. The much weaker attraction between DNA helices with lysine and ornithine peptides compared with arginine is apparent. (B) – The attractive and repulsive free energy components at 25 Å (in units of kT/bp) of the interaction are calculated from the double exponential fits to the osmotic stress force curves and equations (5) and (6). The repulsive, ΔGR(25 Å)/kT, and attractive, ΔGA(25 Å)/kT, free energies, respectively, are shown for the arginine (
 , ◆), ornithine (
 , ■) and lysine (
 , ●) peptides.


