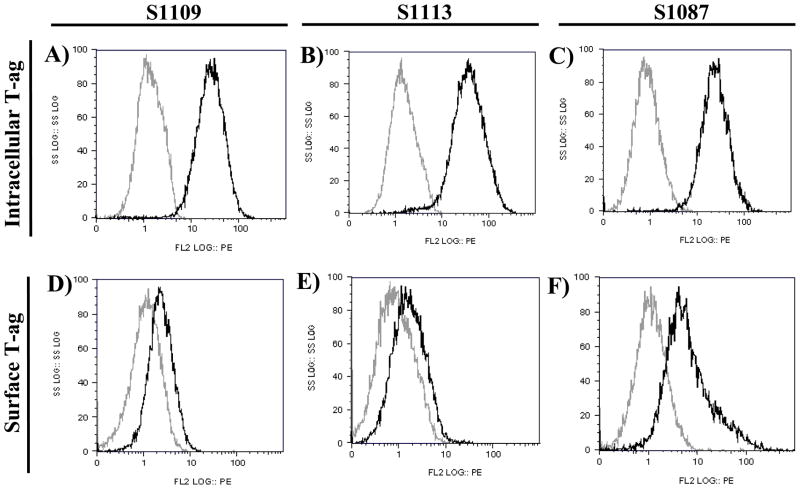
Fig. 3.
Expression of SV40 T-ag detected by intracellular staining or surface staining and flow cytometry on hamster lymphoma cell lines S1109 (Panels A, D), S1113 (Panels B, E), and S1087 (Panels C, F). Intracellular expression (Panels A–C) was detected using PAb101 (black lines); negative control staining was done with mouse IgG2a (gray lines). Surface expression (Panels D–F) of SV40 T-ag was detected using PAb416 (black lines); negative control staining was done with IgG2a (gray lines).

