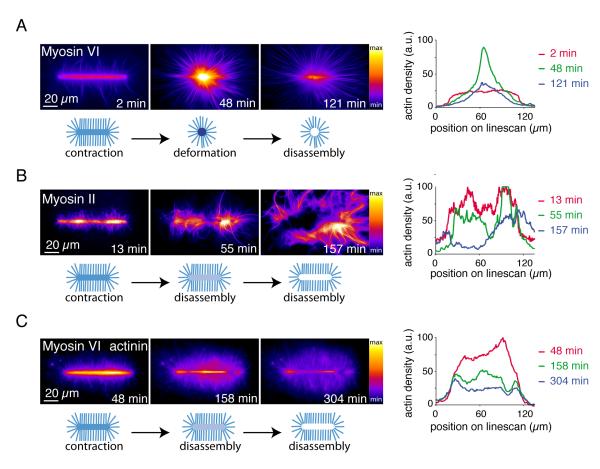
Fig. 1.
Myosin induced actin meshwork contraction and disassembly
(A) Time-series of myosin VI-induced network contraction on a bar-shaped micropattern. Actin filaments were visualized with fluorescent monomers. “Fire” look-up table color-coding reveals variations in actin network densities, quantified with a linescan along the bar at different time points. Actin density peaks because of network deformation after 48 minutes then falls off because of network disassembly. (B) Same as (A) with muscle myosin II-induced contraction. (C) Same as (A) with 100 nM alpha-actinin in the polymerization mix.

