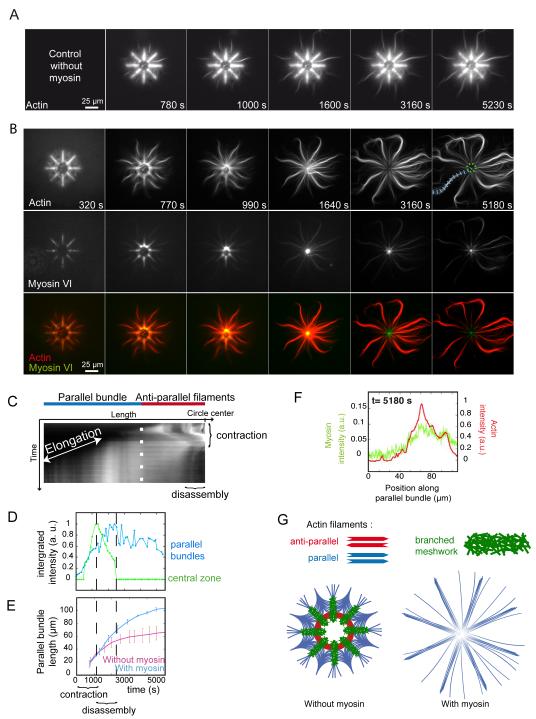
Fig. 2.
Regioselective action of myosins
(A) Time-series of network assembly on an eight-branch actin nucleating radial array. (B) Time-series of myosin VI-induced architecture selective contraction and disassembly (actin, myosin and an overlay are shown). (C) Kymograph of actin fluorescence along a parallel bundle (blue dashed line in B) 5180 s) and central region of actin filaments (dashed green circle in B) 5180 s), showing the different localization of elongation and contraction, disassembly. (D) Fluorescence intensity of a central zone (dashed green circle in B) and a parallel bundle (blue dashed line in B) over time. (E) Length variations of parallel bundles over time in absence or presence of myosins. (F) Linescan of fluorescence intensity along a parallel bundle confirming myosin presence all along. (G) Schematic representation of the final architecture on an eight-branch actin nucleating radial array in absence and in presence of myosins in solution.

