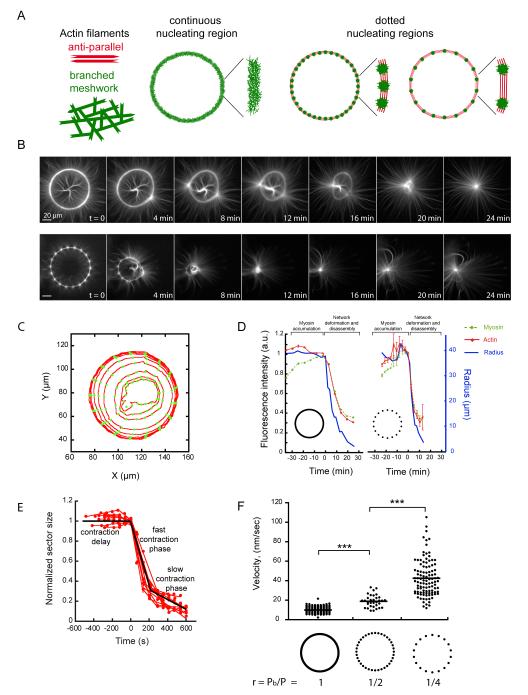
Fig. 3.
The proportion of anti-parallel filaments regulates network contraction rate.
(A) Schematic representation of actin networks nucleated on a full and dotted rings. (B) Time-series of myosin-induced contraction of actin networks nucleated from full (top) and dotted (bottom) rings. (C) Illustration of automated network contraction analysis (23). Each circle represents a time point. (D) The radius and total fluorescence intensities of both actin and myosin were recorded for all angular sectors over time. (E) Ring constriction kinetics. Time series of length values (red dots) could be fitted by three distinct phases (black line). (F) Fast contraction phase velocity measurements were compared between various ring compositions.

