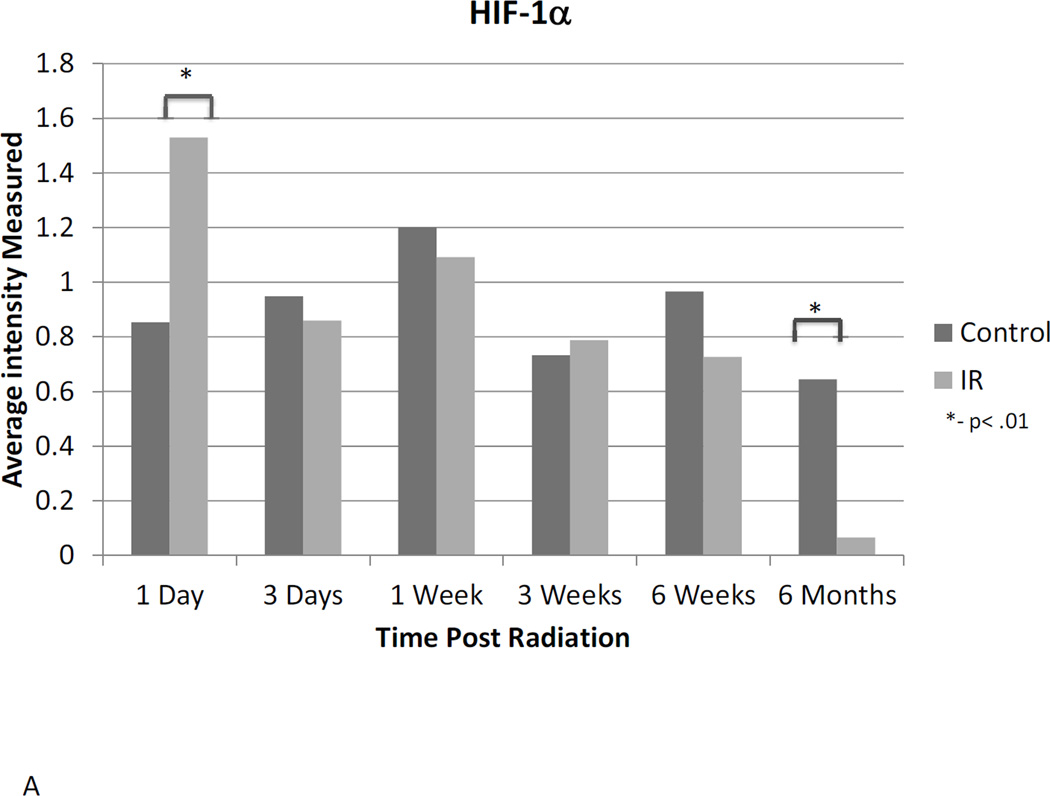
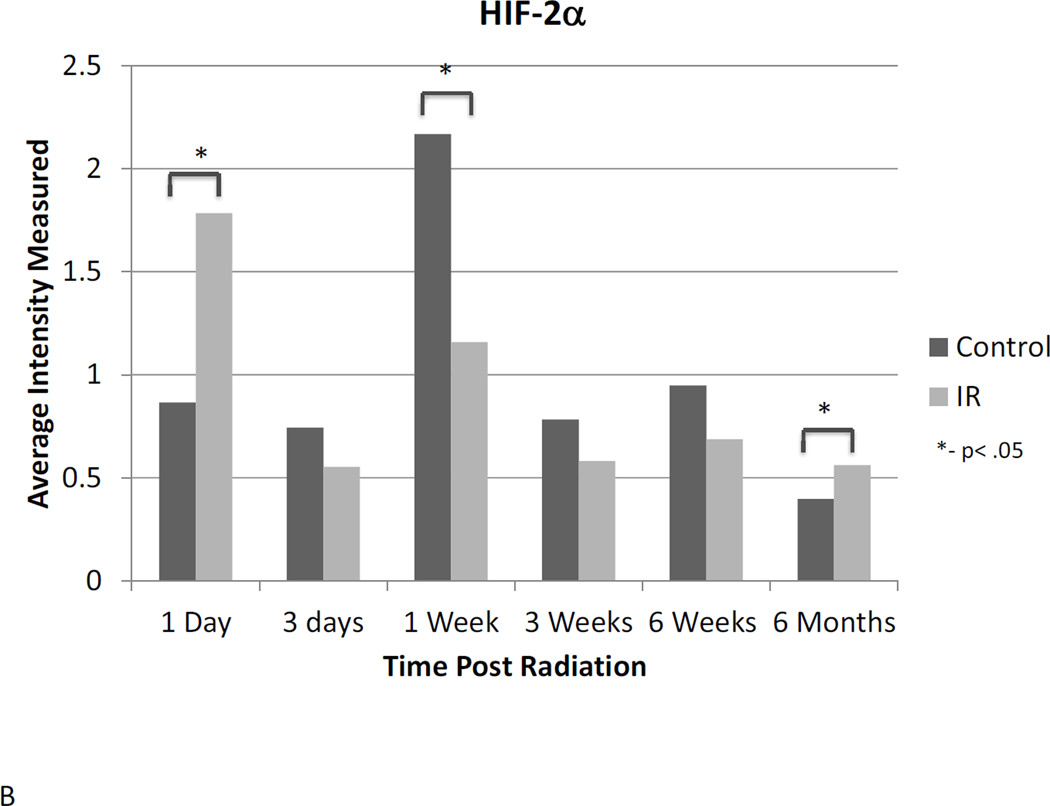
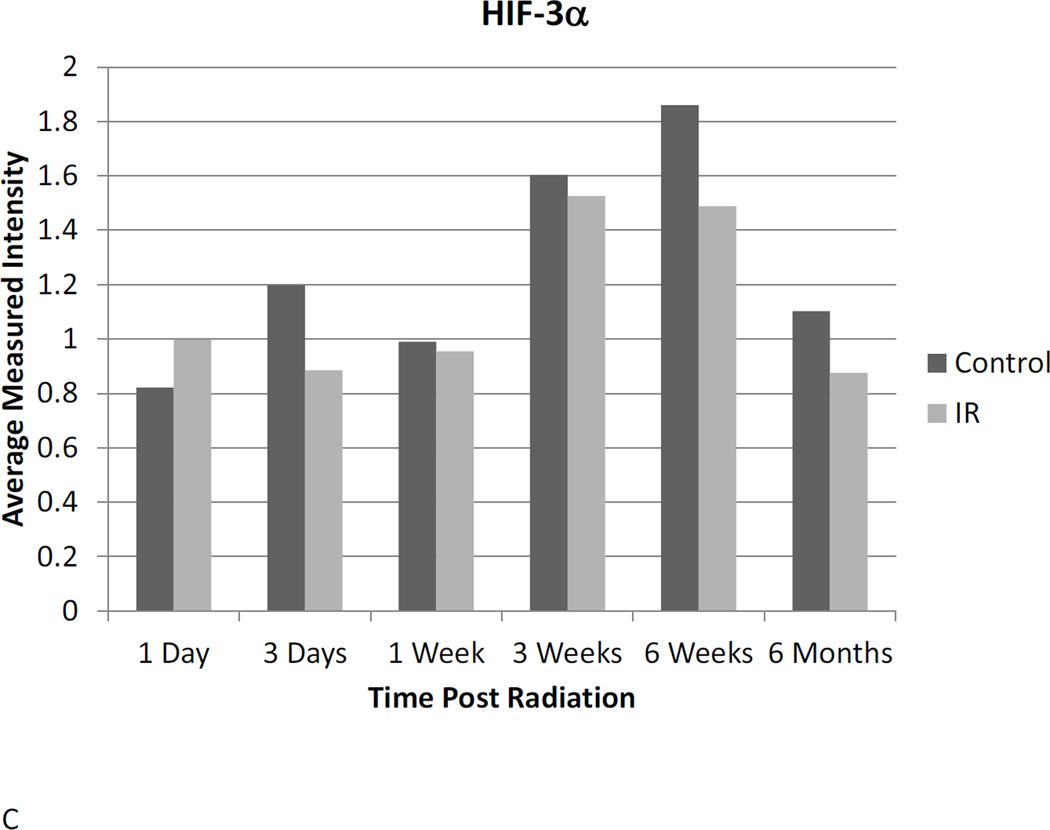
Figure 3. Western blot analysis illustrates the dynamic changes in stabilization of HIF-1α (A) and HIF-2α (B) proteins changes over time following irradiation, while HIF-3α (C) remains constant.
Western blot bands were visualized and normalized based on α-tubulin expression. The relative intensities were measured and averaged within groups and irradiated animals were compared to time matched controls. 1d: 1 day, 3d: 3 days, 1wk: I week, 3wk: 3 weeks; 6wk: 6 weeks, 6m: 6 months, C: control, R: radiation.


