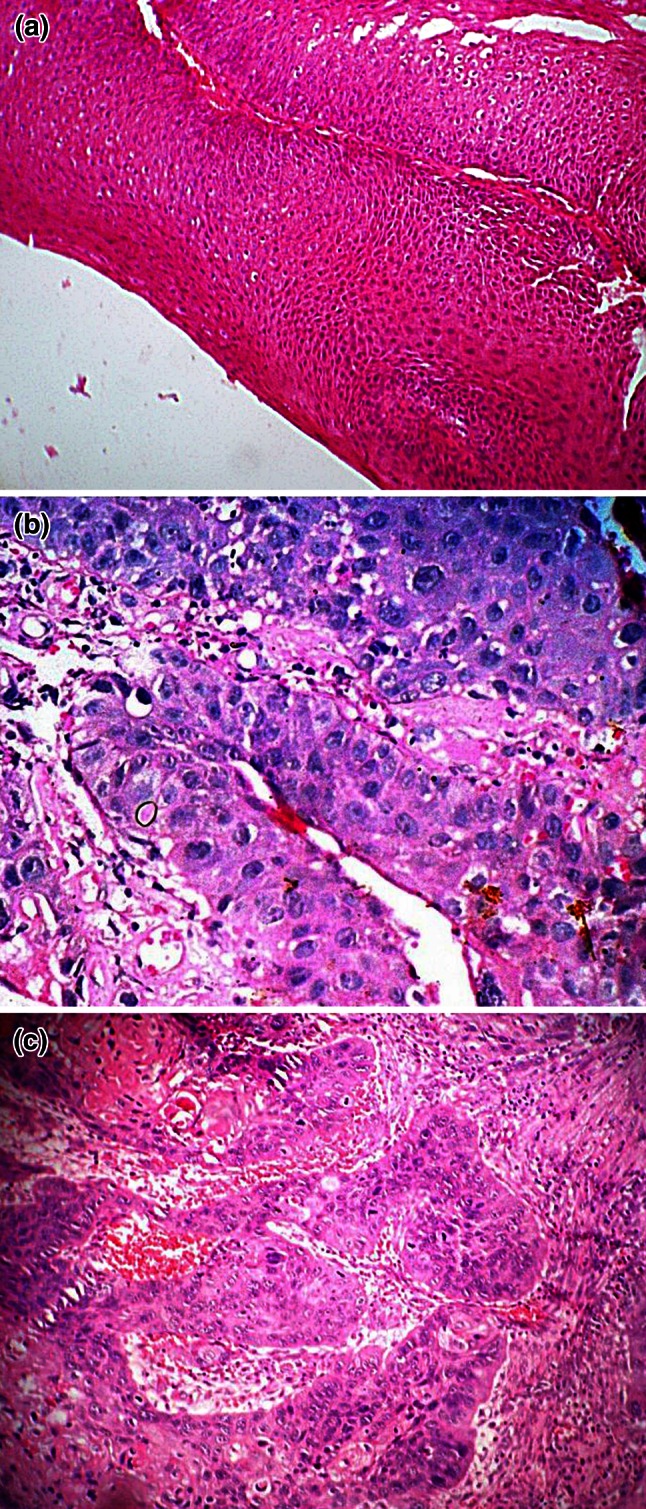
Fig. 2.

a Photomicrograph showing low power view of hyperplasia (H&E, ×100). b Photomicrograph showing high power view of severe dysplasia (H&E, ×400). c Photomicrograph showing high power view of moderately differentiated squamous cell carcinoma (H&E, ×400)
