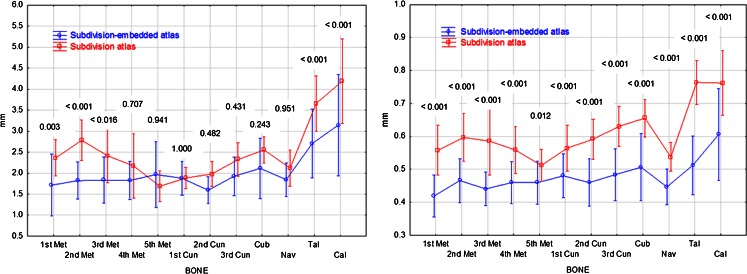
Fig. 4.
Plots of Hausdorff and mean distances for each bone for the subdivision-embedded atlas and subdivision atlas methods. Vertical lines are 95% confidence intervals. For each bone, the Tukey honestly significant difference p value for the comparison of the two methods is shown above the interval lines

