
Figure 6.
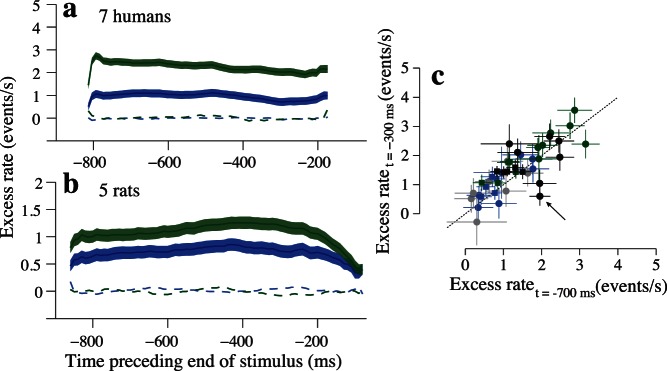
Pooled data indicate that most subjects integrate sensory evidence over the entire course of the trial. (a) Pooled auditory data from all seven humans. Line/color conventions are the same as in Figure 5. (b) Pooled auditory data for the five rats. (c) Scatter plot with data for all subjects comparing the value of excess rates early in the trial (700 ms before stimulus offset) and late in the trial (300 ms before stimulus offset). Color indicates unisensory trial type. Blue: low-reliability auditory; green: high-reliability auditory; gray: low-reliability visual; black: high-reliability visual. Shape indicates species. Circles: humans. Squares: rats. Arrow highlights a single human subject with unusual behavior for high-reliability visual trials. This is the same subject represented in Figure 5e.