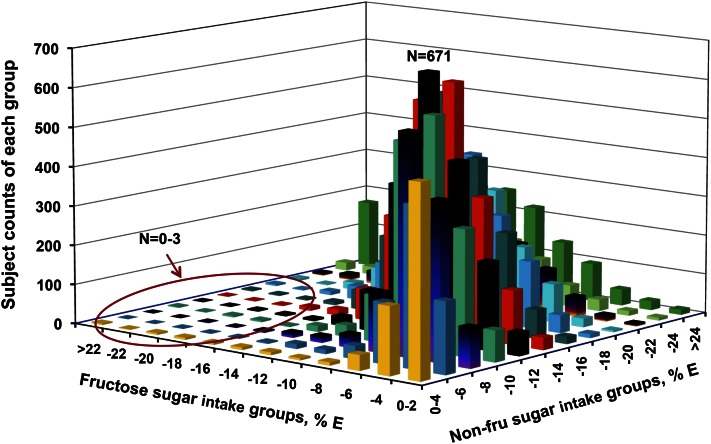
Figure 5.
Sample size distribution by interaction of fructose and nonfructose (non-fru) intakes (NHANES; % kcal in adults; n = 17,749). X-axis = fructose % E (percentage of total energy), y-axis = nonfructose sugars % E, and z-axis = subject frequency (counts from 0 to 671). Fructose generally contributed less daily energy than nonfructose sugars, the ratios of fructose to nonfructose sugars were held in a fairly narrow range, and consumption of fructose or nonfructose sugar alone as the dominant sugar was uncommon in the typical American diet. For example, in the circled left-front area, the frequencies of participants who had higher fructose intakes without allied high nonfructose sugar intakes are very low (0–3 subjects for many cells). Humans consume mixtures of sugars, not fructose or glucose in isolation. % E, percentage of total energy. Reproduced with permission from (22).

