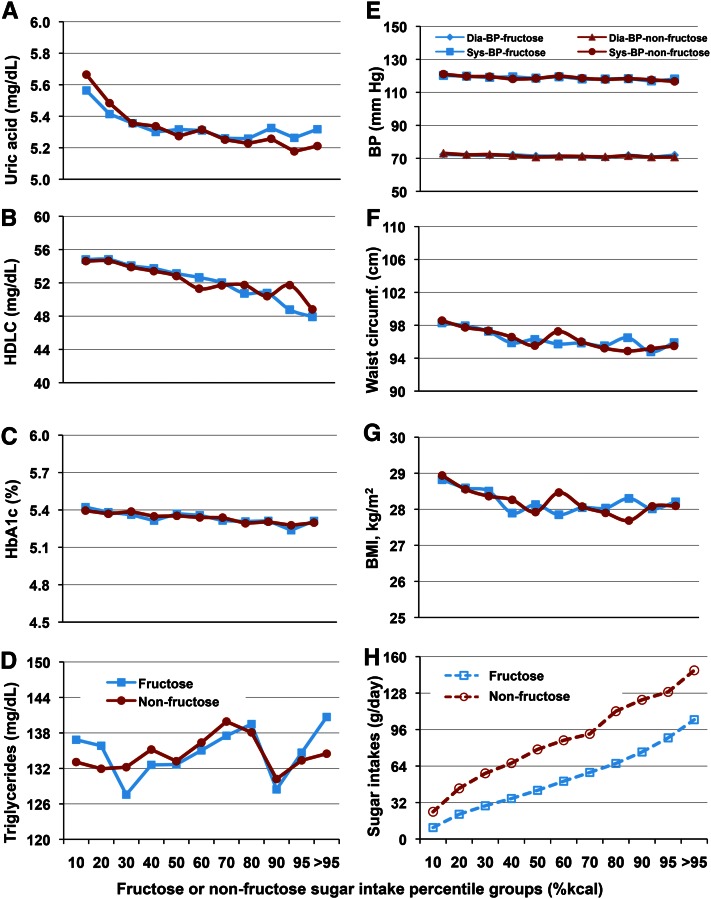
Figure 8.
Relationship of biochemical markers for metabolic syndrome with fructose/nonfructose sugar intakes (energy percentile) in adults, n = 8065. Solid lines connecting filled blue squares and red circles represent the biochemical markers against fructose and nonfructose, respectively, for A through G. In H, broken lines and open blue squares and red circles represent fructose and nonfructose sugars intakes in g/d, respectively, across the sugar intake percentile groups. There were no significant differences between fructose and nonfructose sugars for any of the markers and no changes in clinical importance across all intake percentiles. BP, blood pressure; HDLC, HDL cholesterol; HbA1c, glycohemoglobin. Adapted with permission from (22).

