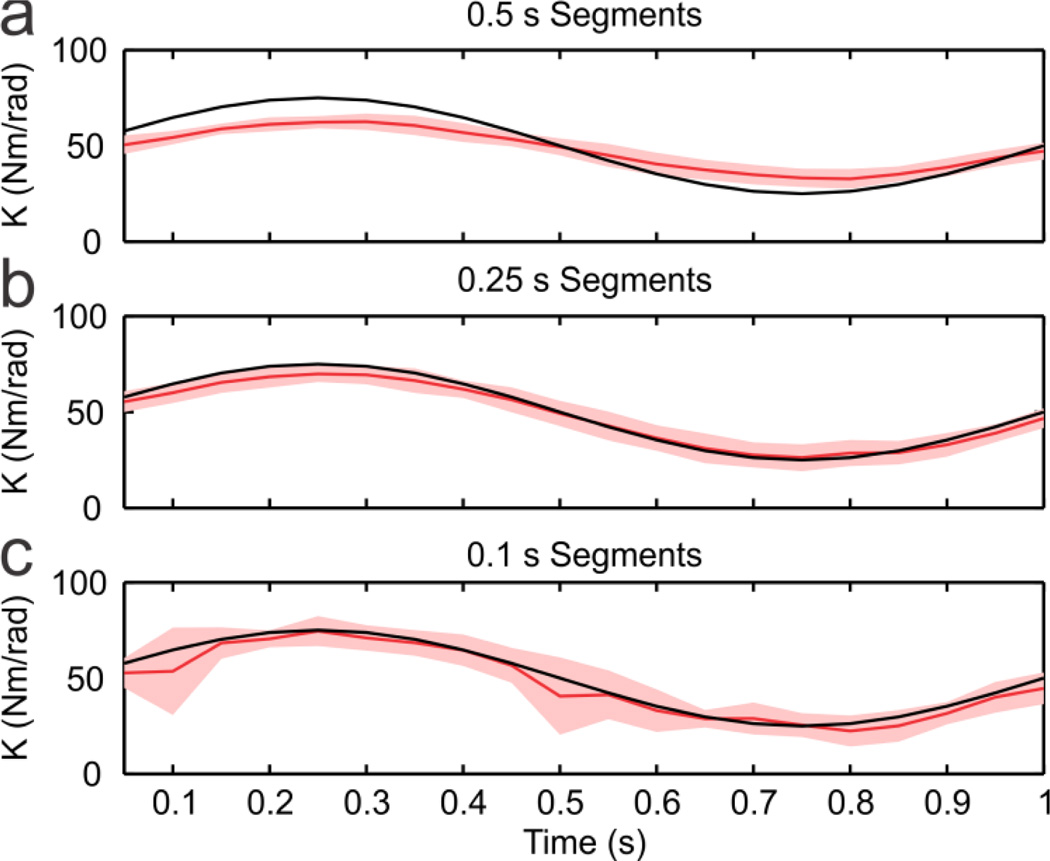
Fig. 4.
Estimation of time-varying behavior. Time-varying data was segmented into data segments of different length and the multi-segment algorithm was run on the data segments. The black lines show the simulated K, the red lines shows the K estimates and the shaded red regions show 1 standard deviation of the estimates.

