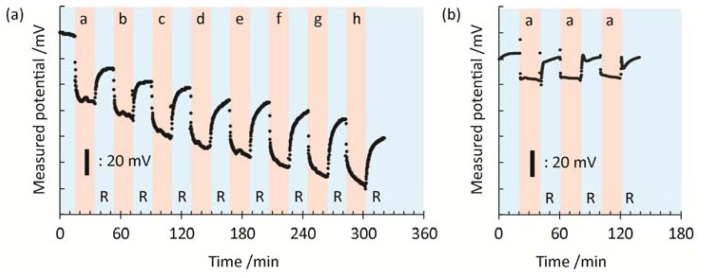
Figure 2.
(a) Time-course of potential changes at the solution/electrode interface by applying DNA target with increasing concentration in 5× SSC buffer and by rinsing with 0.1× DPBS in stepwise manner to the gold electrode modified with MCH SAM containing the 20-mer PNA probes. (b) Stability of measured potential with repeated cycles of blank-rinse solutions. DNA target concentration: a. blank; b. 100 aM; c. 1 fM; d. 10 fM; e. 100 fM; f. 1 pM; g. 10 pM; h. 100 pM. R: rinsing.

