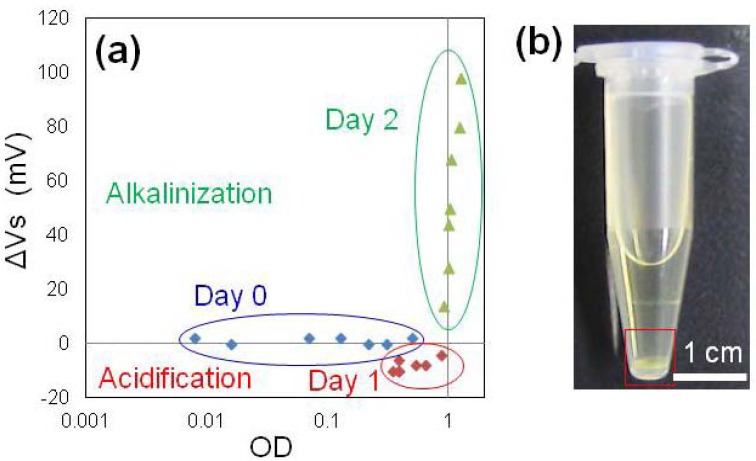
Figure 3.
(a) Relationship between turbidity and pH measured by ISFET in medium containing M. luteus. Voltages in the vertical axis indicate the difference between the M. luteus suspension and the medium (ΔVs). Absorbance is shown in a log scale. (b) Biofilm formation in the PS microtube. A M. luteus biofilm was observed at the bottom of the microtube (red square).

