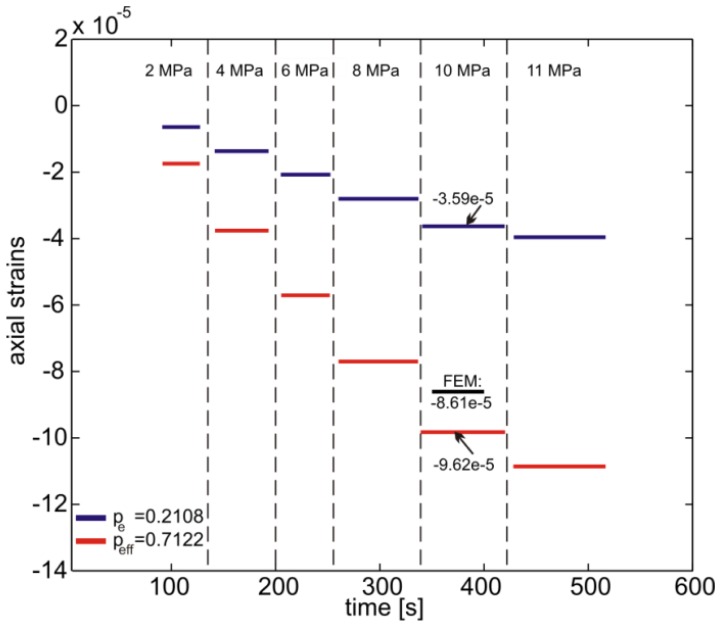
Figure 6.
Bare fiber subjected to hydrostatic pressure: comparison between strain calculated from the wavelength shift measurements and Equation (4a) with pe = 0.2108 as well as Equation (6a) with . The vertical dashed lines indicate the application time of each pressure step. The FE prediction for 10 MPa pressure is also shown.

